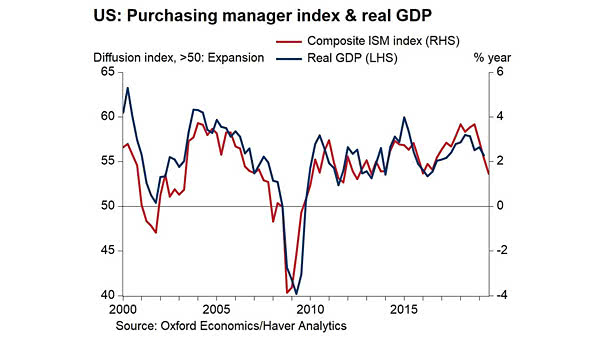
U.S. ISM PMI Composite Index and U.S. Real GDP
U.S. ISM PMI Composite Index and U.S. Real GDP Chart showing the correlation between the U.S. ISM PMI Composite Index and U.S. real GDP. The service sector is still expanding. Image: Oxford Economics
U.S. ISM PMI Composite Index and U.S. Real GDP Chart showing the correlation between the U.S. ISM PMI Composite Index and U.S. real GDP. The service sector is still expanding. Image: Oxford Economics
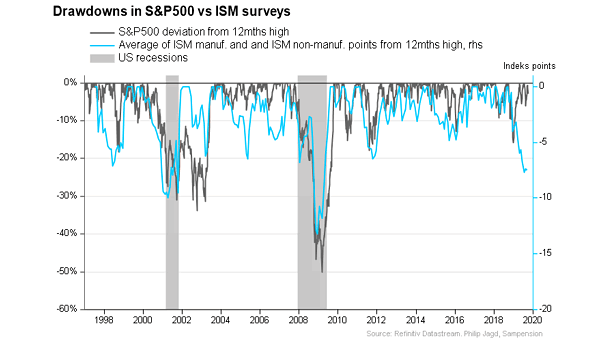
Drawdowns in S&P 500 vs. ISM Surveys Interesting chart showing drawdowns in S&P 500 versus ISM surveys. Weakness in the manufacturing and service sectors matters. Image: Sampension

ISM Manufacturing Index, ISM Non-Manufacturing Index and U.S. GDP U.S. services sector suggests that the U.S. economy is weathering the trade war. Image: Institute of International Finance
U.S. Total Private Employment Another interesting chart showing that the U.S. job market is still strong for the time being, although it is slowing. The U.S. services jobs (blue lines) appear to be in fairly good shape. Image: Robin Brooks
World Exports Are Contracting – May 2019 Nowadays, exports of goods and services represent 29% of global GDP and trade tensions are causing a contraction in world exports. Image: First Eagle Investment Management
How to Get Inflation? Mainly, inflation comes from excess money supply growth. There is too much money in the system chasing too few goods and services. Nominal GDP = M x V = P x T M = quantity of money V = velocity of circulation of money P = level of prices T =…
How is the Relationship Between the Fed and the Stock Market? The stock market influences the real economy of goods and services through the wealth effect. And the Fed responds to stock price movements only to the extent justified by their impact on the macro economy. A picture is worth a thousand words, and Hedgeye shows…
Is U.S. Household Debt a Problem? Not really, right now. Actually, the level of household debt alone does not tell an accurate picture of the current situation. However, U.S. household debt to GDP is much lower, U.S. household debt service payments as a percent of disposable personal income and U.S. household financial obligations as a percent…
Where Does Inflation Come From? Mainly inflation comes from excess money supply growth. There is too much money in the system chasing too few goods and services. Over the long term, Nominal GDP = Money Supply x Velocity of Money = Inflation + Real Economic Growth “Inflation is always and everywhere a monetary phenomenon.” –Milton Friedman. You…
Why Potential GDP Has Been Cut in Half Since the 1950’s? The main reason is a lower productivity than previous business cycles, due to: – lower population growth – the service sector is growing faster than the industry sector – lower quality jobs in the service sector have a lower productivity than in the industrial…
Why U.S. Productivity Is Lower Than Previous Business Cycles? The real yield is the most important measure of financial tightness. But as the real yield is near zero, artificially low interest rates are then associated with unnecessary debt, zombie firms and lower productivity than previous business cycles. Zombie firms cannot invest, innovate and increase productivity. …