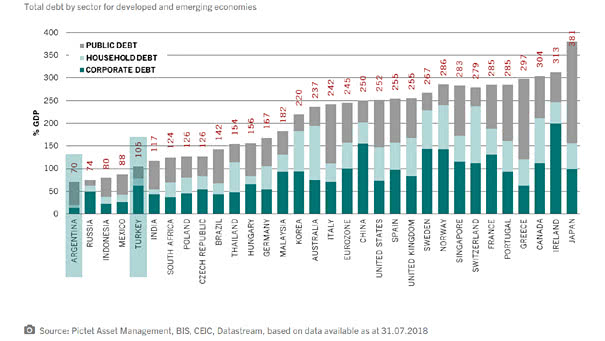
Total Debt by Sector for Developed & Emerging Economies
Total Debt by Sector for Developed & Emerging Economies Argentina is the least indebted market in terms of GDP, while Japan is the most indebted market in terms of GDP. The United States’ total debt is 252% of GDP. Image: Pictet Asset Management