S&P 500 Returns During Presidential Election Years
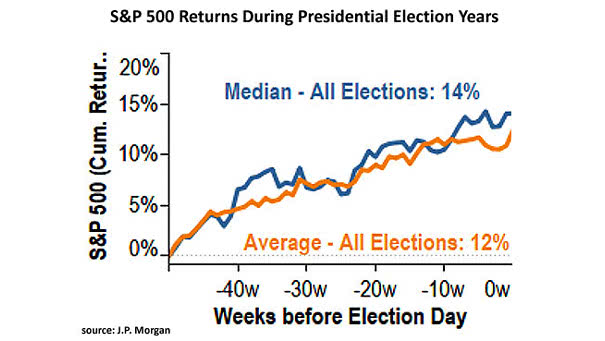
S&P 500 Returns During Presidential Election Years Historically, the S&P 500 has gained an average of 12% in the year before a presidential election. Image: J.P. Morgan
S&P 500 Returns During Presidential Election Years Historically, the S&P 500 has gained an average of 12% in the year before a presidential election. Image: J.P. Morgan
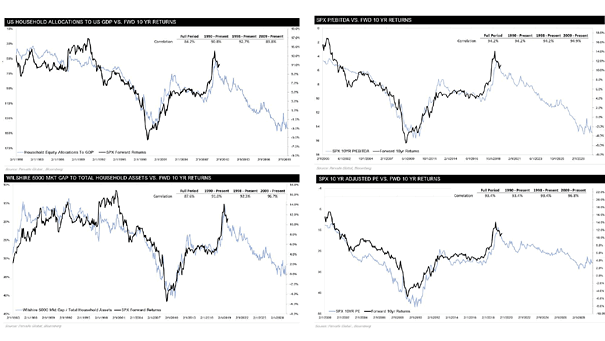
S&P 500 Forward 10 Year Returns Charts suggesting that S&P 500 returns will be weak for the next 10 years. Image: Pervalle Global Click the Image to Enlarge

S&P 500 Average Return for Each Day This spreadsheet shows the S&P 500 average return for each day from 1950 to 2018. “History never repeats itself but it rhymes” –Mark Twain. October 28 has been historically the best day of the year for the S&P 500. You may also like “S&P 500 vs. Its Seasonal Pattern.” Image: Ryan…
S&P 500 Long-Term Trend and Expected Returns Chart suggesting that the 5 and 10-year return forecast is not very exciting. Image: Ned Davis Research
S&P 500 Total Return During Pre-Election Years “What we learn from history is that people don’t learn from history. And you certainly see that in financial markets all the time.” –Warren Buffett Image: Ryan Detrick, LPL Financial LLC
S&P 500 Returns After Three 25 Basis Point Rate Cuts Chart showing what the S&P 500 did after three rate cuts of 25 basis points in 1975, 1996 & 1998. Image: Ryan Detrick, LPL Financial LLC
Asset Class Returns in YTD 2019 The S&P 500 Index, US Treasury bonds, gold and crude oil are all positive this year. This situation is quite rare. It never happened before, to have them all up double digits. Image: LPL Research
Returns Per Asset Class in YTD 2019 This chart shows what investors should have bought in 2019. Image: Deutsche Bank Global Research
S&P 500 Total Return vs. BarclayHedge Hedge Fund Index Hedge funds have underperformed the S&P 500 over the past decade, but volatility has been lower. Image: The Daily Shot, Bloomberg
60/40 Portfolio Annual Returns A 60/40 portfolio has delivered an annualized return of 10.15% since 1976, with positive returns in 35 of 43 years. But the coming years may be more challenging, because investors may face a period of lower returns. Image: Ritholtz Wealth Management LLC
Shareholder Return vs. Free Cash Flow Thanks to low interest rates, shareholder return has exceeded free cash flow levels again. U.S. companies cannot spend more than they earn indefinitely. Image: Goldman Sachs Global Investment Research