6-Month S&P 500 Return Following U.S. Election

6-Month S&P 500 Return Following U.S. Election Since 1932, the median 6-month S&P 500 return for an all Republican sweep has been 4% vs. 1% for an all Democratic sweep, and 3% for a divided government. Image: Goldman Sachs Global Investment Research

S&P 500 Total Return During Pre-Election Years

S&P 500 Total Return During Pre-Election Years “What we learn from history is that people don’t learn from history. And you certainly see that in financial markets all the time.” –Warren Buffett Image: Ryan Detrick, LPL Financial LLC

S&P 500 Performance Leading to U.S. Election Date

S&P 500 Performance Leading to U.S. Election Date This table shows that over the last 20 election cycles in the U.S., there have been only two instances of market declines in the 12 months leading to the election results. Image: J.P. Morgan Asset Management

S&P 500 and Pre-Election Year

S&P 500 and Pre-Election Year In pre-election years since 1950, the chart suggests that the U.S. stock market doesn’t bottom until Thanksgiving. Image: Ryan Detrick, LPL Financial LLC

S&P 500 Index Performance 3-Months Before A Presidential Election

S&P 500 Index Performance 3-Months Before A Presidential Election The S&P 500 performance 3-months before the U.S. Presidential election is very accurate in predicting the election winner. You may also like “Unemployment and U.S. Presidential Elections.” Image: Ryan Detrick, LPL Financial LLC

S&P 500 Four-Year Presidential Cycle

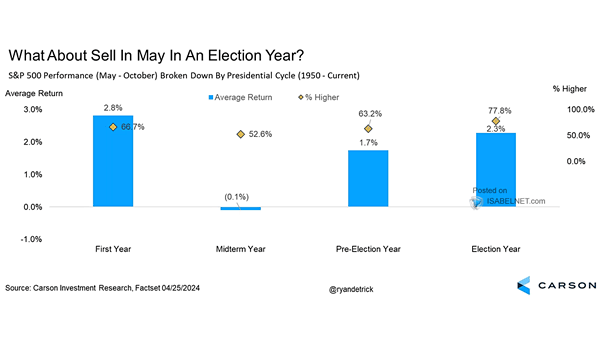
S&P 500 Four-Year Presidential Cycle Midterm election years tend to shake up U.S. markets, as policy risks and political noise rise before voters hit the polls. Uncertainty is the one asset every portfolio gets stuck with, and election season always adds more to the mix. Image: Carson Investment Research

S&P 500 Quarterly Returns Based on the Four-Year Presidential Cycle

S&P 500 Quarterly Returns Based on the Four-Year Presidential Cycle Midterm election years have a rough reputation. Q2 is usually the weakest quarter in the presidential cycle for U.S. stocks. With Q1 set to close deeply in the red, could this time be the exception? Image: Carson Investment Research