M2 / Equity Market Capitalization vs. S&P 500
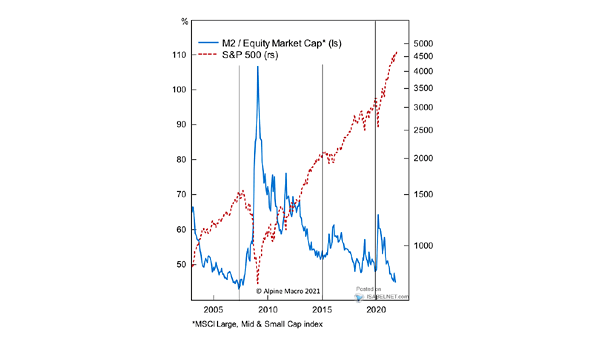
M2 / Equity Market Capitalization vs. S&P 500 Could a liquidity shortage send the S&P 500 lower? Image: Alpine Macro
M2 / Equity Market Capitalization vs. S&P 500 Could a liquidity shortage send the S&P 500 lower? Image: Alpine Macro
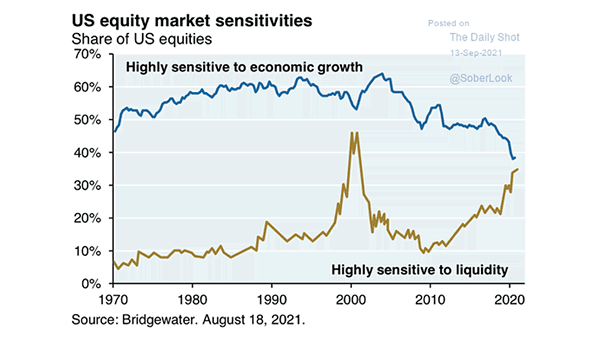
U.S. Equity Market Sensitivities How long will liquidity fuel the U.S. stock market rally? Image: The Wall Street Journal

U.S. 10Y-2Y Treasury Yield Curve and U.S. ISM Manufacturing Index In a situation of extreme excess liquidity, is the U.S. 10Y-2Y yield curve a broken indicator? Image: Morgan Stanley Wealth Management
Equity Flows in H1 Could too much liquidity create market instability? Image: BofA Global Investment Strategy
Valuation – Margin-Adjusted Price/Earnings Ratio on U.S. Stocks and U.S. Stocks Price/Revenue Ratio Will central bank liquidity continue to push valuations higher indefinitely? Image: Financial Times
S&P 500 and Bank Reserves U.S. excess liquidity is expected to rise significantly and tends to push equities higher. Image: Nordea and Macrobond
Cash – Cumulative Increase in Savings Deposits at Commercial Banks Household excess liquidity remains strong. Is it a contrarian bullish signal for stocks? Image: Morgan Stanley Wealth Management
G10 Central Bank Expected Average Monthly Quantitative Easing (QE) in 2021 Central banks are expected to provide more liquidity to markets in 2021. Image: Morgan Stanley Research
Emerging Markets Debt Yield The cost of servicing emerging markets debt denominated in U.S. dollars has fallen to almost 4%, thanks to global central bank liquidity and the weakening of the U.S. dollar. Image: Morgan Stanley Wealth Management
Flows – IG Bond Funds/ETFs and Prime Money Market Funds From record outflows to large inflows, the Fed has solved the liquidity crisis so far. Image: BofA Global Research
Gold, U.S. Trade Weighted Dollar and S&P 500 In 2008, gold outperperformed after the Fed stepped in and removed liquidity constraints. Image: Goldman Sachs Global Investment Research