S&P 500 Returns During Presidential Election Years
S&P 500 Returns During Presidential Election Years Historically, the S&P 500 has gained an average of 12% in the year before a presidential election. Image: J.P. Morgan
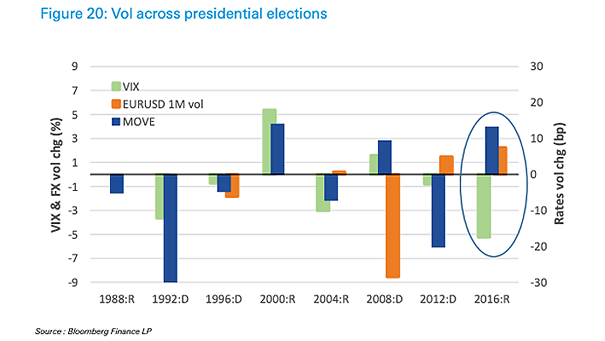
Volatility Across U.S. Presidential Elections Chart showing that outside of recessions, U.S. presidential elections did not contribute much to the volatility of equities, rates and forex. Image: Deutsche Bank Global Research
Growth Over U.S. Presidential Terms Since 1960, the U.S. economy has grown faster in the fourth year of the president’s term. Image: ANZ Research
S&P 500 Average Performance – Presidential Election Years and Incumbent Party Outcome The S&P 500 performance 90 days before the U.S. Presidential election is very accurate in predicting the election winner. If the S&P 500 is up in the 90 days leading to election day, the incumbent party usually wins. This is true for 90%…
S&P 500 Quarterly Performance by Presidential Cycle Chart showing the breakdown of the S&P 500 quarterly performance by presidential cycle since 1950. Image: Ryan Detrick, LPL Financial LLC
S&P 500 After Official Presidential Impeachment Inquiry Chart showing that two presidential impeachment inquiries had two different results. Image: Sentimentrader
U.S. Recession and Presidential Re-election If there isn’t a recession ahead of the U.S. presidential re-election, presidents have won every time since the First World War. The spreadsheet also shows that five of the seven times there was a recession, the current U.S. President lost the re-election. You may also like “Unemployment and U.S. Presidential…
Presidential Election – U.S. Presidential Score Sheet for the Final Year of the First Term Historically, a U.S. president is re-elected when at least consumer confidence and the unemployment rate improve. Image: BofA Merrill Lynch
U.S. Yield Curve 18 Months Before Presidential Elections 18 months before presidential elections, a flatter yield curve suggests a greater tendency to predict a change away from the incumbent President’s party Image: Deutsche Bank
S&P 500 Index and Fed Funds Rate vs. U.S. Presidential Elections Since 1956, history tells us that the S&P 500 is more important than the Fed, within 12 months preceding the U.S. presidential election. Image: Renaissance Macro