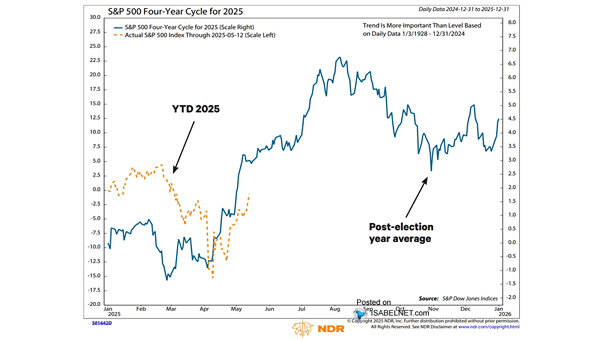
10-Year U.S. Government Yield
10-Year U.S. Government Yield After more than a decade, 10-year U.S. government yields have finally returned to their long-term average levels of 4.5%. Image: Deutsche Bank
S&P 500 Performance When Up YTD Between 10-20% At the End of September When the S&P 500 is up year-to-date between 10-20% at the end of September, the fourth quarter tends to be bullish. Historical trends are not a guarantee of future performance, but they can provide useful insights for investors and traders when making…
S&P 500 Historical FY2 EPS Revisions vs. Consensus EPS The good news is that consensus EPS estimates for both 2023 and 2024 are currently being revised upward, indicating positive expectations for future earnings performance. Image: BofA US Equity & Quant Strategy
U.S. Equities Fund Flows U.S. equity funds have experienced substantial weekly outflows, indicating a significant shift in investor sentiment. Image: BofA Global Investment Strategy
U.S. 10-Year Treasury Yield Since 1790 Factors like inflation, economic growth, and the Fed’s monetary policy can all impact the trajectory and duration of the U.S. bond bear market. Image: BofA Global Investment Strategy
The Conference Board Leading Economic Index (LEI) for the U.S. The U.S. LEI decreased by 0.4% in August, suggesting weaker economic activity ahead. Image: The Conference Board
U.S. Job Openings and S&P 500 The stock market is forward-looking, while job openings often reflect current economic conditions. Image: BofA Global Investment Strategy
Treasuries Flows There have been strong inflows into U.S. Treasury funds, indicating that investors maintain a high level of trust and confidence in government debt. Image: BofA Global Investment Strategy
Inflation – U.S. CPI Forecasts If the Federal Reserve is done with rate hikes, the U.S. headline CPI is expected to remain well above the Fed’s 2% inflation target. Image: BofA Global Investment Strategy
Valuation – Real S&P 500 Index with Recessions and S&P 500 Shiller CAPE Ratio The S&P 500 is trading at relatively high valuations, which will eventually matter. Image: Real Investment Advice