Seasonality – S&P 500 60-Day Rolling Forward Return
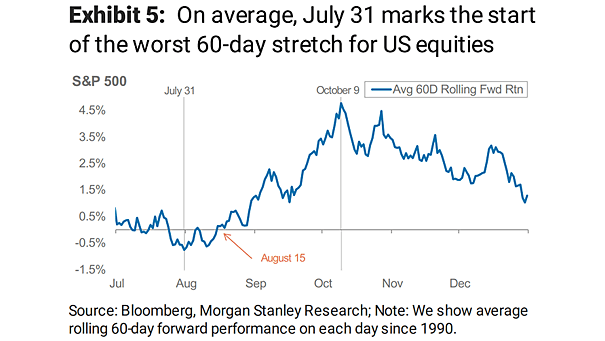
Seasonality – S&P 500 60-Day Rolling Forward Return On average, July 31 marks the start of the worst 60-day stretch for the S&P 500 since 1990. Image: Morgan Stanley Research
Seasonality – S&P 500 60-Day Rolling Forward Return On average, July 31 marks the start of the worst 60-day stretch for the S&P 500 since 1990. Image: Morgan Stanley Research
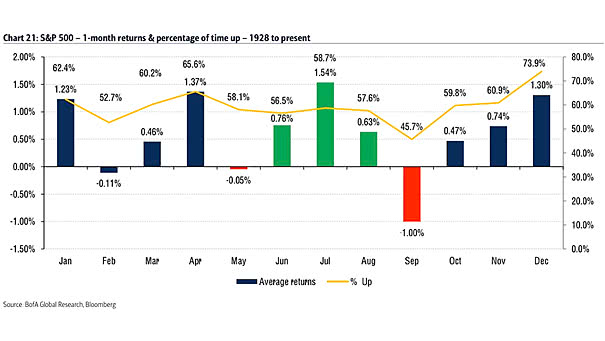
Seasonality – S&P 500 1-Month & Percentage of Time Up If you “sell in May and go away”, you could miss a summer rally, as June-August is historically the second best 3-month period. Image: BofA Global Research

Seasonality of U.S. Equity Market Sentiment Index This chart puts into perspective the seasonal pattern in U.S. equity sentiment. Image: Nomura
Seasonality of the Baltic Dry Index The Baltic Dry Index has declined as a result of seasonality and the coronavirus. Image: Nomura
VIX and S&P 500 Seasonality The chart shows the seasonality map for the VIX and the S&P 500, and how they move in opposite directions. Image: Topdown Charts
Monthly S&P 500 Seasonality Back to 1928 The monthly seasonality of the S&P 500 could suggest a pause in February. Image: BofA Global Research
Seasonality – 2019 S&P 500 Performance by Month vs. the 1980-2018 Average This year, the S&P 500 seasonality looked different than its historical pattern since 1980. Image: CNBC
MSCI Emerging Markets Seasonality Chart showing the MSCI EM seasonality chart since 1990. This is not a forecast. Image: Goldman Sachs Global Investment Research
S&P 500 and Seasonal Rotation Strategy Sell in May and go away? This chart suggests that a rotation between defensive and cyclical sectors was a much better strategy Image: CFRA, S&P Global
Nasdaq 100 and S&P 500 Seasonality The Nasdaq 100 and S&P 500 seasonality chart from 1985 to 2018 (excluding 2008). This is not a forecast. Image: Goldman Sachs
Seasonality – S&P 500 Cycle Composite for 2019 This great chart shows the S&P 500 cycle composite for 2019 vs. the actual S&P 500 composite (places equal weight on: one-year seasonal cycle, four-year presidential cycle, and 10-year decennial cycle). This is not a forecast. Image: Ned Davis Research