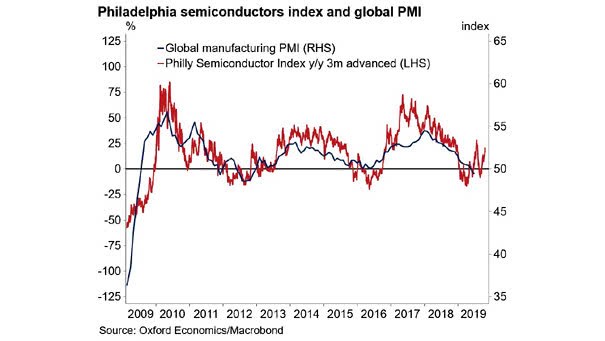
Various S&P 500 Index 6-Month Returns Since 1950
Various S&P 500 Index 6-Month Returns Since 1950 Historically, the Nov-Apr period is the best 6 months of the year for stocks. Image: Ryan Detrick, LPL Financial LLC
MSCI World Growth Index vs. MSCI World Value Index Over the past decade, global value stocks have remained in the shadow, while the sun has shone on global growth stocks. Image: Financial Times
How Much Do the FAANMGs Matter to the S&P 500 since 1/26/18? FAANMG stocks pushed S&P 500 up 2.24%, and other stocks (S&P 500 less FAANMG) pushed S&P 500 down 2.55%. Image: Bianco Research
September S&P 500 Return vs. October S&P 500 Return Does an up September for stocks mean an up October? It is an old myth and there’s no real correlation (R = 0.03). Image: McClellan Financial Publications, Inc.
Share Buybacks in China Chinese companies are buying back record amounts of stocks. Image: Goldman Sachs Global Investment Research
Relative Performance of MSCI World Factors In the last two weeks, the shift to value stocks may indicate that investors expect rates to rise. Image: Financial Times
Inequality – Concentration of Stock Ownership by Wealth Class in the U.S. The top 1% own 50% of stocks held by American households. Image: Yahoo! Finance
Growth, Momentum, Volatility and Value Factor Performance Chart showing that value stocks make a comeback as momentum and growth stocks get hammered. Image: Goldman Sachs Global Investment Research
U.S. Equities at 70-Year Highs vs. European Equities Are European stocks more attractive than U.S. stocks? Currently, the euro area economy is more impacted by the global slowdown than the U.S. economy. And investors also think that the euro area economy is less resilient than the U.S. economy in the event of a shock. Image: BofA…
S&P 500 Index After U.S. Treasury 2-10 Year Yield Curve Inversion The chart shows that stocks outperform after yield curve inversion (green line: average year from 1950 to 2017). Image: LPL Research
U.S. Business Cycle Indicator The Morgan Stanley’s cyclical indicator is still in “downturn.” The entry into the “downturn” phase suggests lower returns for stocks and risky assets. Image: Morgan Stanley Research