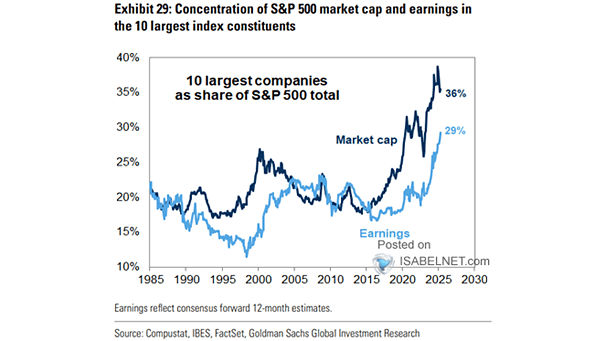
Valuation – 12-Month Forward P/E Ranges (MSCI Regions)

Valuation – 12-Month Forward P/E Ranges (MSCI Regions) The high valuation levels seen today in US and global equity markets often suggest a risk of reduced future returns, unless earnings growth picks up enough to justify such prices. Image: Goldman Sachs Global Investment Research

Performance – Value vs. Growth

Performance – Value vs. Growth The U.S. market is experiencing outperformance in growth sectors driven by innovation and strong earnings, whereas value sectors dominate outside the U.S. due to slower earnings growth and differing economic dynamics. Image: Goldman Sachs Global Investment Research

Valuation – S&P 500 NTM P/E

Valuation – S&P 500 NTM P/E Investors assign a higher earnings multiple to the S&P 500 market cap-weighted index than to the equal-weight index, reflecting a clear preference for the growth potential and market dominance of larger companies. Image: Goldman Sachs Global Investment Research

Valuation – S&P 500 Company Actual vs. Modeled FY2 P/E Ratio

Valuation – S&P 500 Company Actual vs. Modeled FY2 P/E Ratio Valuations for the Magnificent Seven now sit slightly below modeled fair value, especially in light of their robust fundamentals and earnings growth. Image: Goldman Sachs Global Investment Research

S&P 500 Target for 2025

S&P 500 Target for 2025 In the coming months, robust earnings, a weaker dollar, anticipated Fed rate cuts, and easing recession fears are expected to make U.S. equities a key driver of the global equity rally. Image: Bloomberg

Valuation – Magnificent 7 P/E Premium vs. S&P 493

Valuation – Magnificent Seven Forward P/E The Magnificent 7 stocks still trade at a premium over the rest of the S&P 500, but that premium has narrowed sharply in 2025 due to underperformance, slower earnings growth, and investors shifting interest to other sectors. Image: Goldman Sachs Global Investment Research

S&P 500 Cash Spending

S&P 500 Cash Spending In 2025, S&P 500 share buybacks are forecast to remain elevated, supported by solid earnings and strong balance sheets, with total repurchases anticipated to exceed $1 trillion. Image: Goldman Sachs Global Investment Research

Valuation – S&P 500 Forward P/E

Valuation – S&P 500 Forward P/E Goldman Sachs’ upward revision of the S&P 500’s forward P/E multiple to 20.4 over the next year reflects increased optimism about earnings growth and the macroeconomic backdrop. Image: Goldman Sachs Global Investment Research

Magnificent 6 (ex. NVDA) vs. S&P 493 Quarterly EPS YoY Growth

Magnificent 6 (ex. NVDA) vs. S&P 493 Quarterly EPS YoY Growth The gap in EPS growth between mega-cap tech and the S&P 493 widened during 1Q 2025, as strong tech earnings and upward revisions contrasted with more cautious or downward-trending guidance for the broader market. Image: Goldman Sachs Global Investment Research