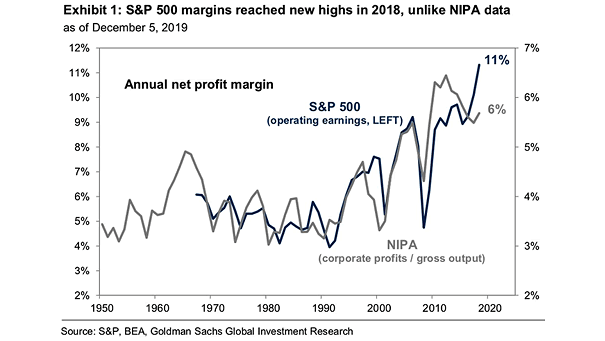
S&P 500 Operating Earnings and NIPA Corporate Profits
S&P 500 Operating Earnings and NIPA Corporate Profits Goldman Sachs expects S&P 500 margins to rise slightly in 2020. Image: Goldman Sachs Global Investment Research
S&P 500 Operating Earnings and NIPA Corporate Profits Goldman Sachs expects S&P 500 margins to rise slightly in 2020. Image: Goldman Sachs Global Investment Research
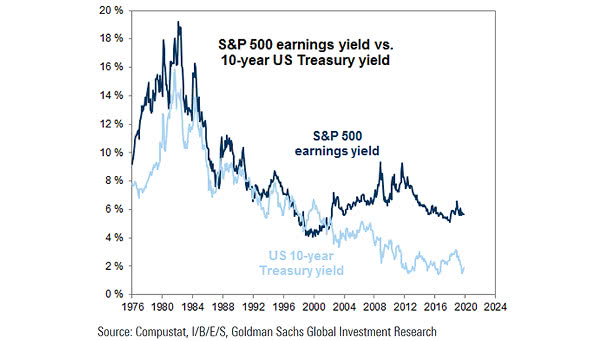
S&P 500 Earnings Yield vs. 10-Year U.S. Treasury Yield The gap between the S&P 500 earnings yield and the 10-year U.S. Treasury yield is currently relatively high. Image: Goldman Sachs Global Investment Research

U.S. Equities and The World: Earnings Growth vs. Multiple Expansion Since the 2009 low, the strong performance of the U.S. markets comes from earnings growth (73%) and multiple expansion (27%). You may also like “S&P 500 Return: Earnings Growth vs. Multiple Expansion.” Image: Goldman Sachs Global Investment Research
Earnings Matter, Over the Long Run Over the long run, equities move with earnings. Currently, there is a big gap between U.S. and Europe earnings. As Warren Buffett said: “for 240 years, it’s been a terrible mistake to bet against America.” You may also like “Global Earnings since 2006.” Image: Cullen Roche
Lumber Prices Are a Great Leading Indicator of Future Earnings This chart suggests that lumber prices give a good forecast of where the stock market is going. When lumber prices fall over a 12-month period, then EPS follows 6 months later. Although there is no immediate recession on the horizon, a market downturn is possible. Image:…
South Korea Exports vs. MSCI World EPS South Korea’s exports tend to lead global earnings. Image: J.P. Morgan
World Semiconductor Sales and S&P 500 EPS Tight relationship between world semiconductor sales and S&P 500 earnings per share. You may also like “Semiconductor Sales vs. Global Earnings per Share.” Image: Oxford Economics
Equity Market Concentration – Market Capitalization of 10 Largest Companies as Share of S&P 500 Total The S&P 500’s top 10 stocks hold a disproportionately large share of the index’s weight relative to their earnings, which amplifies risks tied to volatility, diversification, and sector exposure. Image: Goldman Sachs Global Investment Research
Valuation – 12-Month Forward P/E Ranges (MSCI Regions) The high valuation levels seen today in U.S. and global equity markets often suggest a risk of reduced future returns, unless earnings growth picks up enough to justify such prices. Image: Goldman Sachs Global Investment Research
S&P 500 Quarterly Net Profit Margin (Ex. Financials & Energy) Consensus forecasts indicate that S&P 500 profit margins will remain near record highs in 2025, supported by steady earnings growth and strong economic expansion. Image: Goldman Sachs Global Investment Research
U.S. Equity Index P/E Valuations vs. History The S&P 500’s forward P/E ratio is about 22x, higher than its historical average. While this indicates optimism, it also means the market is more vulnerable to earnings disappointments, increasing potential risks ahead. Image: Goldman Sachs Global Investment Research