Sep
29
2025
Off
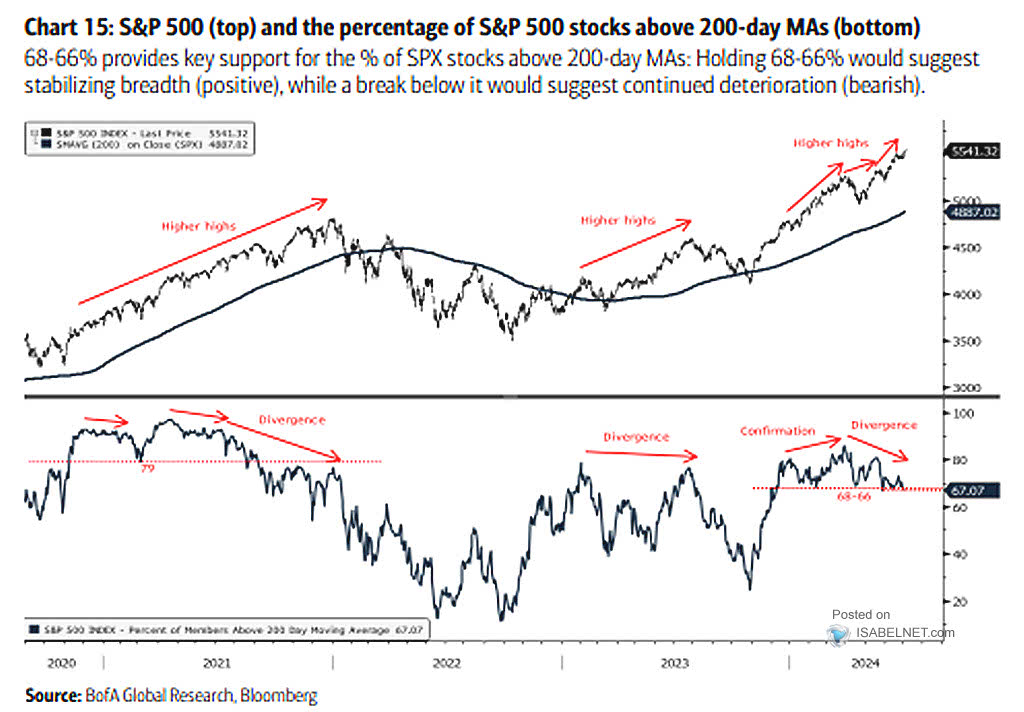
S&P 500 Compared to Its 200-Day Moving Average
With the S&P 500 sitting 10% above its 200-day moving average, the market looks firmly bullish, suggesting more upside potential until a local peak around 13–15% above the 200-dma—roughly 6,950—comes into play.
Image: Fundstrat Global Advisors, LLC
