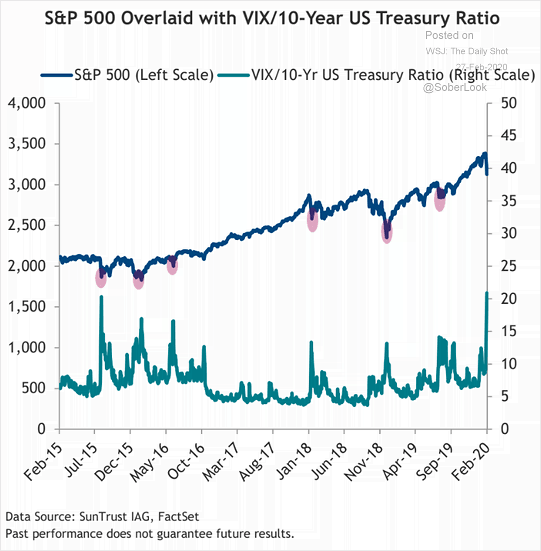
Feb 27 2020 Off S&P 500 and VIX/10-Year U.S. Treasury Ratio Chart showing how spikes in the VIX/10-Year U.S. Treasury ratio result in lower equity prices.Image: Truist