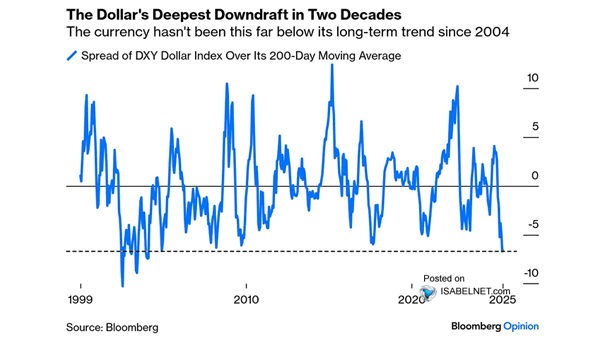
GS U.S. Financial Conditions Index

GS U.S. Financial Conditions Index The easing of financial conditions starting in October 2023 has produced a similar outcome to around 100 bps of rate cuts, which could potentially affect the Fed’s interest rate decision-making process. Image: Goldman Sachs Global Investment Research

U.S. Stock Market Bull and Bear Indicator

U.S. Stock Market Bull and Bear Indicator Using multiple financial data, this great model helps investors navigate through different market conditions. It suggests whether the U.S. stock market tendency is bullish, bearish or neutral. It is a contrarian indicator. A bullish signal suggests that the U.S. stock market may go up, while a bearish signal…

U.S. ISM Manufacturing Index and U.S. GDP Growth

U.S. ISM Manufacturing Index and U.S. GDP Growth The large gap that currently exists between the U.S. ISM Manufacturing Index and U.S. real GDP will eventually close, as economic indicators tend to align over time. Image: Deutsche Bank Asset Allocation

U.S. Stocks – Magnificent Seven Market Value as a Percent of S&P 500 Market Value

U.S. Stocks – Magnificent Seven Market Value as a Percent of S&P 500 Market Value The concentration of the Magnificent Seven U.S. stocks has a significant impact on the performance of the S&P 500. While these stocks have performed well, the over-reliance on them poses potential risks for investors. Image: BofA Global Investment Strategy

Investor Sentiment – U.S. Market Greed/Fear Index

Investor Sentiment – U.S. Market Greed/Fear Index The Market Greed/Fear Index stands at 86.28, indicating an extreme level of greed in the U.S. stock market, which could potentially lead to overconfidence and poor decision-making. Image: Real Investment Advice

Equity – U.S. Households Aggregate Financial Asset Allocation

Equity – U.S. Households Aggregate Financial Asset Allocation Currently, U.S. households allocate 48% of their total financial assets to equities. This allocation reflects a high level of risk exposure, as equities are known for their volatility and potential for capital loss. Image: Goldman Sachs Global Investment Research

U.S. GDP Growth

U.S. GDP Growth Goldman Sachs Research’s optimistic outlook on the growth of the U.S. GDP is based on their projections for strong economic performance and their confidence in the resilience of the U.S. economy. Image: Goldman Sachs Global Investment Research

The Conference Board Leading Economic Index (LEI) for the U.S.

The Conference Board Leading Economic Index (LEI) for the U.S. In February, the U.S. LEI increased by 0.1%, showing positive momentum for the U.S. economy. However, it still signals potential headwinds for future growth. Image: The Conference Board

U.S. Stocks – Cyclicals vs. Defensives

U.S. Stocks – Cyclicals vs. Defensives Cyclicals and defensives are reliable indicators of investor sentiment. Anticipated economic growth prompts investors to favor cyclicals, resulting in their outperformance over defensives. Image: Goldman Sachs Global Investment Research