U.S. Regime Indicator
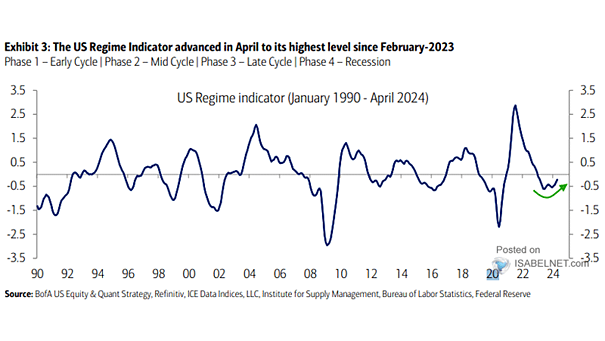
U.S. Regime Indicator In April, the U.S. regime indicator showed improvement, indicating positive signs and encouraging trends, which is great news. Image: BofA US Equity & Quant Strategy
U.S. Regime Indicator In April, the U.S. regime indicator showed improvement, indicating positive signs and encouraging trends, which is great news. Image: BofA US Equity & Quant Strategy
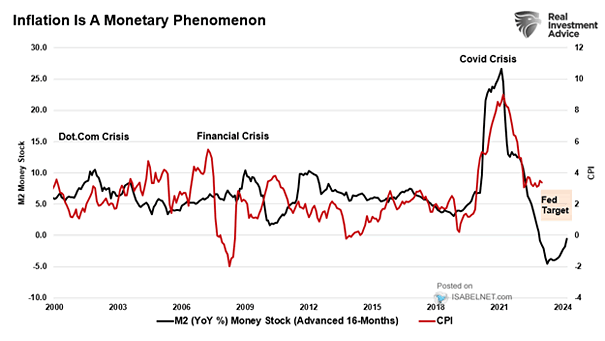
M2 Money Supply and CPI Inflation The significant decline in money supply growth is one of the factors contributing to the contraction of inflation in the United States. Image: Real Investment Advice
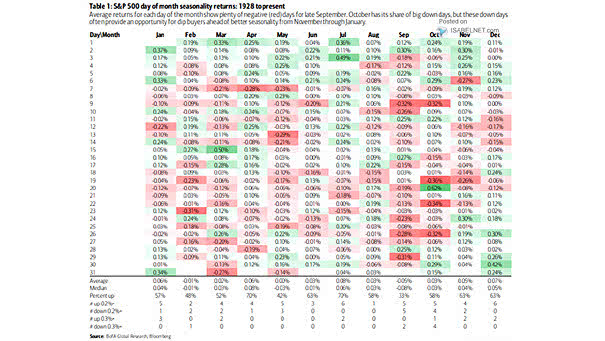
S&P 500 Day of Month Seasonality Returns Considering seasonality, it would not be surprising to see a bounce-back in the S&P 500 in early June, as historically, this period has demonstrated a trend of positive returns. Image: BofA Global Research
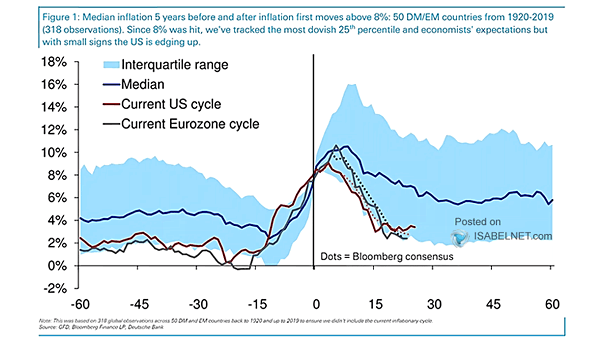
What Happens Globally When Inflation Hits 8% Historically, after a spike above 8%, global median inflation tends to be stickier over the following 5 years, causing economic challenges and impacting the purchasing power of individuals and businesses. Image: Deutsche Bank
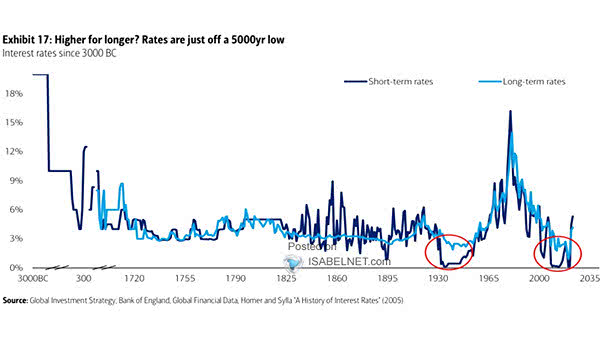
Interest Rates Since 3000BC The end of the era of low interest rates could potentially have far-reaching implications for both consumers and businesses. Image: BofA Global Investment Strategy
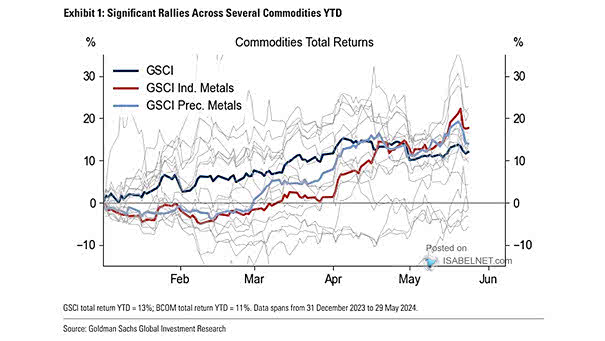
Commodities Total Returns Several commodities have experienced significant rallies so far this year. Will this trend persist in the coming months? Image: Goldman Sachs Global Investment Research
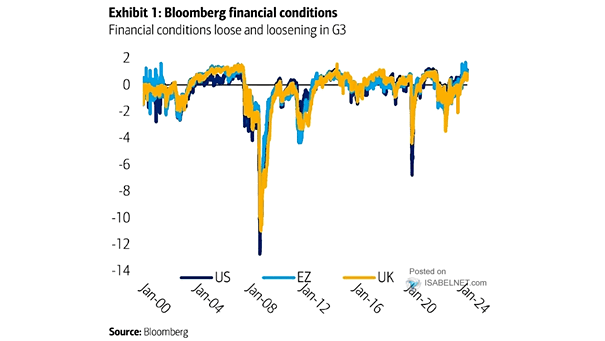
Financial Conditions Financial conditions in G3 economies have been experiencing a trend of loosening, posing challenges for central banks in their efforts to manage inflation and making it more difficult to keep it under control. Image: BofA Global Research
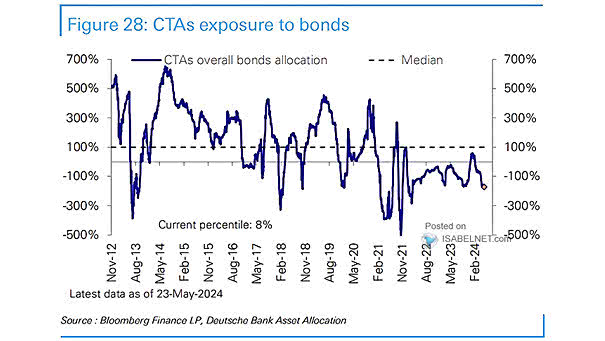
CTAs Exposure to Bonds CTAs’ overall allocation to bonds in the 8th percentile indicates a relatively low exposure to fixed income securities. Image: Deutsche Bank Asset Allocation
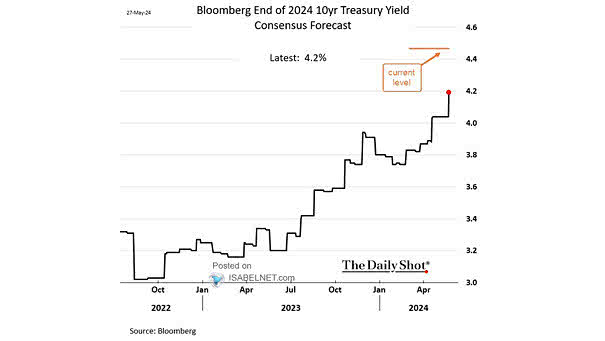
Forecast – U.S. 10-Year Treasury Yield According to consensus, the 10-year U.S. Treasury yield is expected to reach 4.20% by the end of 2024. Image: The Daily Shot
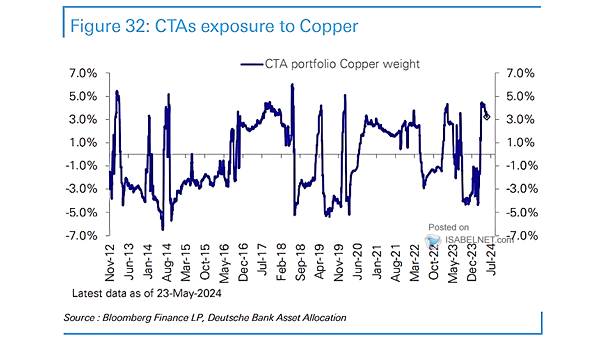
CTAs Exposure to Copper CTAs have a bullish outlook on copper due to the anticipated surge in demand driven by infrastructure development and the global shift towards renewable energy sources. Image: Deutsche Bank Asset Allocation
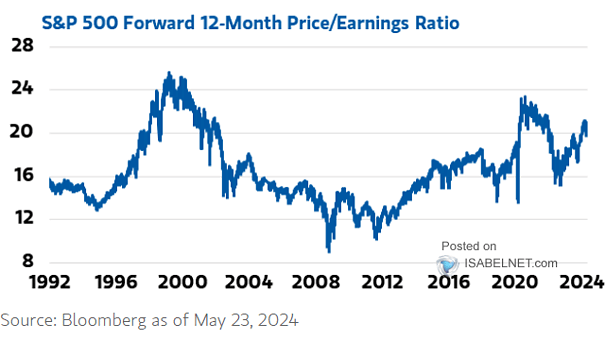
Valuation – S&P 500 12-Month Forward P/E With a forward P/E of 21, the S&P 500’s current valuation is in the 90th percentile compared to the past 100 years. While high valuations may not immediately affect stock prices, they can impact them when market conditions shift. Image: Morgan Stanley Wealth Management