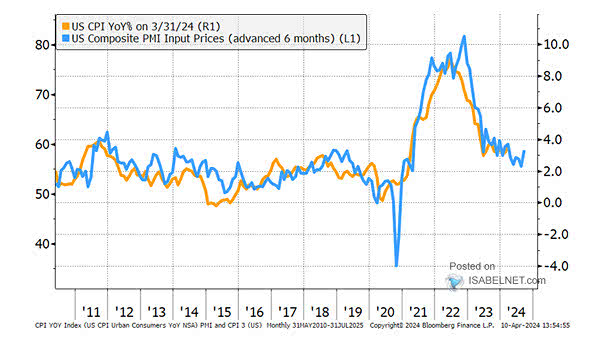
10-Year U.S. Treasury Yield Less CPI
10-Year U.S. Treasury Yield Less CPI Given investors’ historic tendency to demand a 200 basis point premium over inflation rates, could rates rise further? Image: Morgan Stanley Wealth Management
Importance of Macro Driver in Explaining Returns Higher real 10-year UST yields can potentially lead to a decrease in U.S. stock returns, but other factors should also be considered. Image: Goldman Sachs Global Investment Research
U.S. Equity Risk Premium – Long-Term View Should investors approach U.S. equities with caution due to the significant decline in the equity risk premium, which stands well below its historical average? Image: Topdown Charts
S&P 500 When Up 10% or More at the End of June The sell-off in U.S. stocks may not imply a long-lasting bearish period, but rather a temporary dip that could reverse in late October, as years with notable gains in the first half tend to bottom around that time. Image: Carson Investment Research
S&P 500 Performance After a Year of No Record Highs From a historical perspective, the absence of a record high in the S&P 500 Index since the start of the year could indicate the possibility of a substantial rally taking place in 2024. Image: Bloomberg
Global Central Bank Balance Sheets The ongoing trend of central banks purchasing global debt since 2008, will depend on dynamic economic conditions, inflationary forces, and the specific monetary policy goals of each individual central bank. Image: Real Investment Advice
Cycle – U.S. Regimes The U.S. regime indicator remains in the recovery phase, which suggests that there are positive signs and trends indicating improvement. Image: BofA US Equity & Quant Strategy
S&P 500 Average 10-Day Returns Historically, U.S. stocks are entering a seasonally bullish period, associated with positive performance and upward momentum. Image: Carson Investment Research
U.S. 10-Year Treasury Yield – Monthly Chart The gradual approach of the U.S. 10-year Treasury yield towards the secular target carries significant implications for various sectors of the economy and financial markets. Image: BofA Global Research
S&P 500 % of Members Above 200-Day Moving Average A limited number of U.S. stocks driving market performance due to a lack of broad market participation can be problematic, potentially resulting in a less sustainable and robust market environment. Image: Morgan Stanley Research
S&P 500 Earnings Revisions Breadth vs. S&P 500 YoY With yields no longer supporting high valuations, earnings growth is expected to be the main factor driving U.S. equity returns in the near future. Image: Morgan Stanley Research