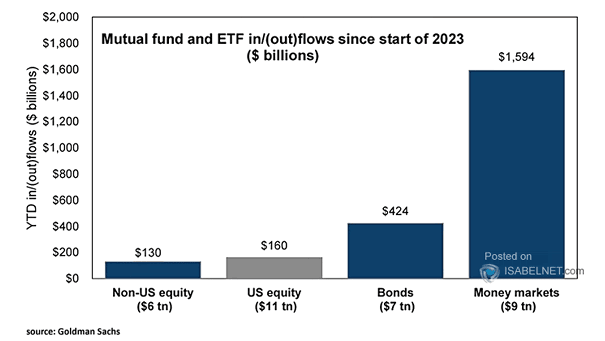
Mutual Fund and ETF In/(Out)Flows
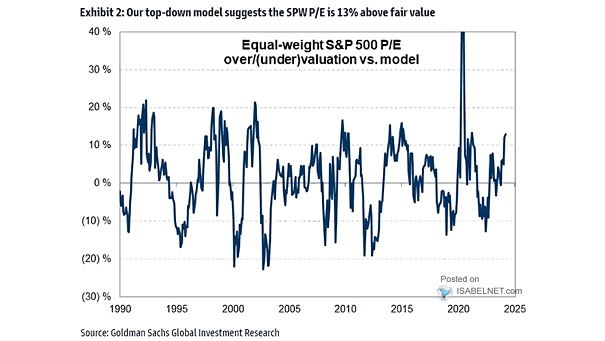
Mutual Fund and ETF In/(Out)Flows Since 2023, cash has emerged as the flow winner. Will it serve as the primary driving force behind the bull markets in the months ahead? Image: Goldman Sachs Global Investment Research