S&P 500 Performance Recovering 50% of Bear Market

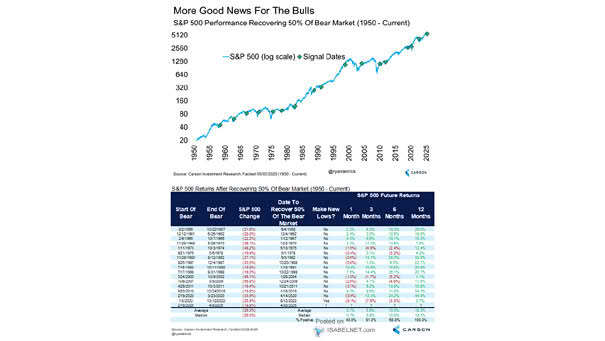
S&P 500 Performance Recovering 50% of Bear Market With the S&P 500 regaining half of its near-bear market losses in 2025, history strongly suggests that the lows may already be behind us. Since 1950, the S&P 500 has always produced positive returns one year later. Image: Carson Investment Research

ISABELNET Cartoon of the Day

ISABELNET Cartoon of the Day After the S&P 500’s 2.92% rise last week, bulls are ready to party, but bears insist it’s too soon to celebrate-a bear market rally might crash the party! Have a Great Week, Everyone! 😎

Median S&P 500 Performance During 10% Corrections

Median S&P 500 Performance During 10% Corrections If there is no recession, U.S. stocks tend to do well after market corrections, often rebounding strongly and offering attractive returns to investors who stay the course. Image: Goldman Sachs Global Investment Research

S&P 500 8-Day Rolling % Returns

S&P 500 8-Day Rolling % Returns Rolling 8-day returns for the S&P 500, combined with technical and sentiment indicators, suggest the index is likely to enter a period of consolidation in the near term. Image: The Daily Shot

ISABELNET Cartoon of the Day

ISABELNET Cartoon of the Day With the S&P 500 up 2.92% this week, bulls are confident the market’s momentum will continue, while bears argue it’s just a bear market rally! Have a Great Weekend, Everyone! 😎

Trade Policy Uncertainty

Trade Policy Uncertainty When trade policy uncertainty peaks, the S&P 500 often posts positive returns. Markets tend to over-discount risks during uncertain periods, and relief rallies are common once worst-case scenarios are avoided or resolved. Image: Goldman Sachs Global Investment Research

S&P 500 Index Return During May

S&P 500 Index Return During May The “sell in May and go away” adage is more myth than practical advice. Rather than trying to time the market, focusing on long-term goals is wiser-especially since May has delivered positive returns in 9 of the past 10 years. Image: Carson Investment Research

ISABELNET Cartoon of the Day

ISABELNET Cartoon of the Day Despite a strong rally this week, the S&P 500 index ended April down 0.76%. No need to panic-this isn’t a call to “Make Bears Great Again!” unless you prefer market declines. Happy Friday, Everyone! 😎

Probability of U.S. Recession As Priced Across Asset Classes

Probability of U.S. Recession As Priced Across Asset Classes The S&P 500 is pricing in about a 25% chance of a recession, which is lower than signals from copper prices or the yield curve, but higher than the recession probabilities implied by global equities or high-yield credit markets. Analysts often use the current percentage change…

S&P 500 Index vs. 200 and 40-Week Moving Averages

S&P 500 Index vs. 200 and 40-Week Moving Averages Despite recent volatility driven by trade concerns, as long as the S&P 500 index is trading above the 200-week moving average, the secular bull market remains intact. Image: Real Investment Advice

Valuation – S&P 500 12-Month Forward P/E Ratio

Valuation – S&P 500 12-Month Forward P/E Ratio The S&P 500’s forward P/E ratio of 20x places it above historical averages, reinforcing the view that current valuations are not historically cheap. Image: The Daily Shot