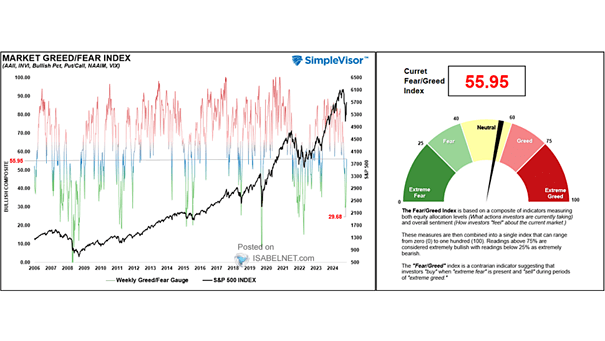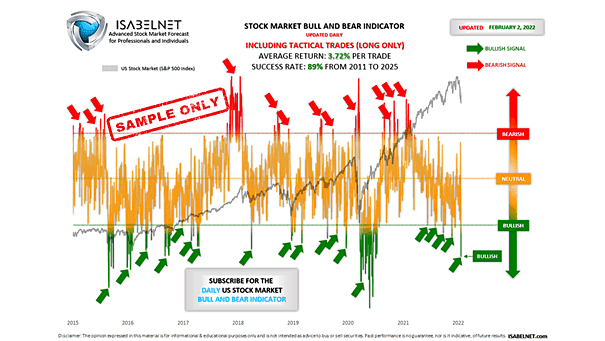
U.S. Stock Market Bull and Bear Indicator – S&P 500
U.S. Stock Market Bull and Bear Indicator – S&P 500 Another strong day. At last Thursday’s close, our Stock Market Bull & Bear Indicator was bullish, and the S&P 500 followed through on Friday, closing…