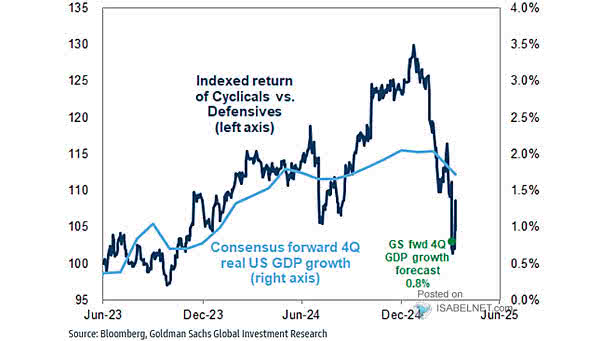
S&P 500 Returns Following Major Geopolitical Events

S&P 500 Returns Following Major Geopolitical Events History shows the same script in over 20 major events since WWII: markets snap back quicker than feared, and those who hold their nerve often win. Panic usually…

Distribution of S&P 500 Annual Returns

Distribution of S&P 500 Annual Returns Since 1928, double-digit annual losses in the S&P 500 have been the exception, not the rule, occurring only 12 times. Today, with record earnings, elevated margins, and sustained AI…

Global Economy – GDP Growth Projections

Global Economy – GDP Growth Projections The IMF projects global growth at 3.1% in 2026 and 3.2% in 2027. Robust tech investment, steady policy support, and a surprisingly flexible private sector are keeping momentum alive…

GS Financial Conditions Index

GS Financial Conditions Index With rates lower and equities climbing, looser US financial conditions are giving both consumer spending and business investment a stronger tailwind. Confidence often strengthens in step. Image: Goldman Sachs Global Investment…

Hyperscaler Capex

Hyperscaler Capex Hyperscaler capex is on track for $755 billion this year, rising to $892 billion by 2027. At that scale, this looks less like a typical tech cycle and more like something structurally bigger.…

Truck Tonnage vs. S&P 500 Index

Truck Tonnage vs. S&P 500 Index The Truck Tonnage Index rose 0.3% in March. Trucks represent 72.7% of U.S. freight and serve as a barometer of the U.S. economy. This chart shows that, historically, the…