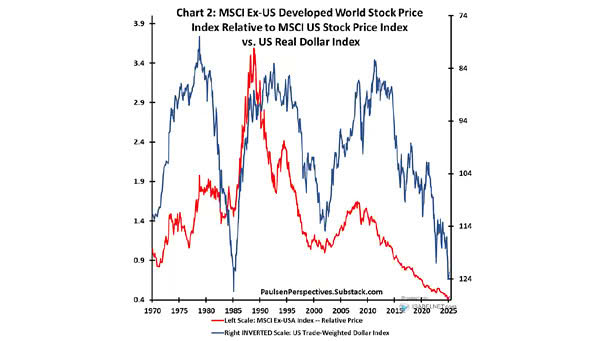
Number of Trading Days Since Last Fed Rate Cut

Number of Trading Days Since Last Fed Rate Cut The Fed’s recent decision to cut interest rates for the first time in four years, in response to changing economic conditions, marks the second-longest wait for…

Inflation – U.S. Core PCE

Inflation – U.S. Core PCE The GS Core Inflation Tracker currently remains below the Federal Reserve’s target of 2%, which is a crucial component of its monetary policy aimed at ensuring price stability and anchoring…

CTA Positioning in U.S. Rates

CTA Positioning in U.S. Rates While CTAs’ current long positions in U.S. rates reflect a bullish outlook, they also serve as a potential contrarian indicator for savvy investors looking to capitalize on market reversals. Image:…

S&P 500 vs. ISM Composite PMI

S&P 500 vs. ISM Composite PMI The divergence between the U.S. ISM Composite PMI and the S&P 500 has become increasingly notable, reflecting contrasting signals about the health of the U.S. economy. Image: Morgan Stanley…

U.S. Real Prime Rate

U.S. Real Prime Rate The 50bps rate cut helps small businesses by lowering borrowing costs. The Fed’s cut aims to stimulate economic activity and support the growth of these essential companies, which play a crucial…

Weekly U.S. Equity Fund Flows

Weekly U.S. Equity Fund Flows U.S. equity funds have seen substantial inflows amounting to $31.74 billion, reflecting a strong positive sentiment among investors, particularly following the Fed’s decision to cut interest rates last week. Image:…

Fed Rate Cuts

Fed Rate Cuts Goldman Sachs forecasts a series of 25bp interest rate cuts through mid-2025, aimed at supporting economic growth amid fluctuating inflation rates. Image: Goldman Sachs Global Investment Research

S&P 500 TTM YoY EPS vs. Fed Funds Target

S&P 500 TTM YoY EPS vs. Fed Funds Target Traditionally, when the Fed starts cutting interest rates, corporate profits tend to decelerate. However, this’s not the case today, highlighting the unique economic landscape we face.…

S&P 500 Average Annual Price Return

S&P 500 Average Annual Price Return Historical data indicates that during positive years, the S&P 500 typically achieves substantial gains, averaging an annual return of 19.0% since 1928. Image: Carson Investment Research

U.S. vs. Developed Market Equities (ex-US) Price Relative

U.S. vs. Developed Market Equities (ex-US) Price Relative While there is potential for U.S. equities to maintain their lead in the near term due to strong earnings and market dynamics, historical cycles suggest that this…

S&P 500 Historical Earnings-per-Share (EPS)

S&P 500 Historical Earnings-per-Share (EPS) The consensus projection suggests that the S&P 500 will achieve 18% EPS growth by the end of 2025, reflecting confidence in corporate profitability as we move into 2025. Image: BofA…