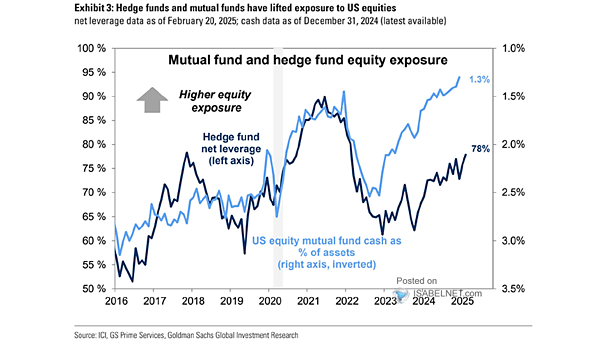
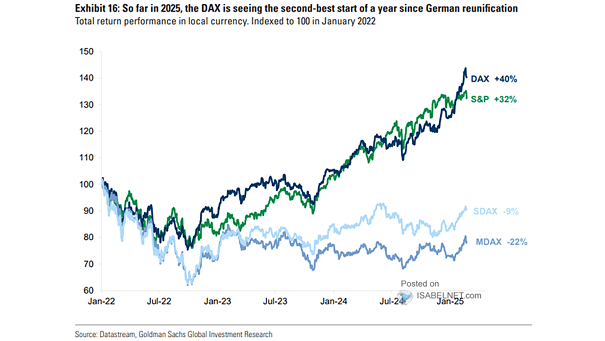
Distribution of Forecast 10-Year Annualized S&P 500 Returns

Forecast 10-Year Annualized S&P 500 Returns Based on the 10-year annualized total return forecast distribution, there’s a 72% likelihood that the S&P 500 will underperform Treasury bonds, and a 33% probability that equities will generate…

S&P 500 Performance the Year After a Negative Midterm Year

S&P 500 Performance the Year After a Negative Midterm Year Given that U.S. stocks have consistently performed well in pre-election and election years following a negative midterm year since 1950, investors may have reason to…

U.S. Bond Yields

U.S. Bond Yields The era of ultra-low interest rates that followed the 2008 financial crisis should be seen as a historical anomaly. It is unlikely that U.S. bond yields will return to their post-crisis lows.…

U.S. Budget Deficit and Current Account

U.S. Budget Deficit While higher deficits can provide short-term economic stimulus and potentially extend business cycles, they also pose risks to long-term economic stability. Image: Deutsche Bank

S&P 500 Stocks – Average Earnings Day Moves

S&P 500 Stocks – Earnings Day Moves Last quarter set a 15-year record for earnings day volatility, with 12% of S&P 500 stocks experiencing price movements greater than 10%. Image: Goldman Sachs Global Investment Research

U.S. Stocks – Cyclicals vs. Defensives

U.S. Stocks – Cyclicals vs. Defensives Investor sentiment is often reflected in the performance of cyclicals versus defensives. Typically, expectations of economic growth lead to a preference for cyclicals, resulting in their outperformance relative to…

Recession – NFIB Sales Expectations

Recession – NFIB Sales Expectations Optimism among U.S. small business owners regarding future sales has significantly declined, with many anticipating a drop in revenues over the coming months. Image: Real Investment Advice

10-Year Turnover of S&P 500 Constituents

10-Year Turnover of S&P 500 Constituents Over a typical 10-year period, 36% of S&P 500 constituents experience turnover. This level of turnover is significant, highlighting the challenges of tracking long-term performance for individual firms within…

Cumulative Advance-Decline Line for the S&P 500 Index

Cumulative Advance-Decline Line for the S&P 500 Index The S&P 500 advance-decline line is a crucial indicator of market trends and sentiment. An all-time high typically indicates favorable news for the U.S. stock market. Image:…

Copper to Gold Ratio and U.S. 10-Year Treasury Yield

Copper to Gold Ratio and U.S. 10-Year Treasury Yield The copper-to-gold ratio is often considered a leading indicator for the direction of the 10-year U.S. Treasury yield under certain market conditions. Image: The Daily Shot

10-Year Annualized S&P 500 Returns

10-Year Annualized S&P 500 Returns Goldman Sachs predicts that the S&P 500 will achieve an average annualized return of only 3% in the coming decade, considerably below historical norms, reflecting concerns about high equity valuations.…