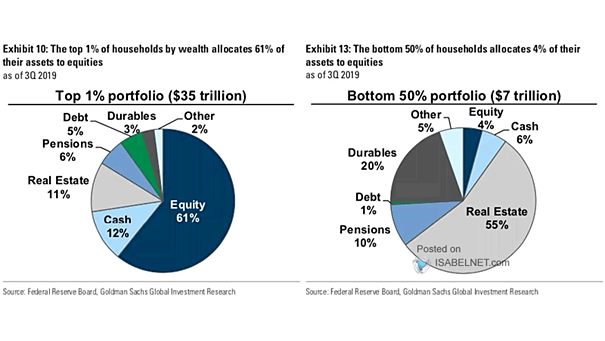
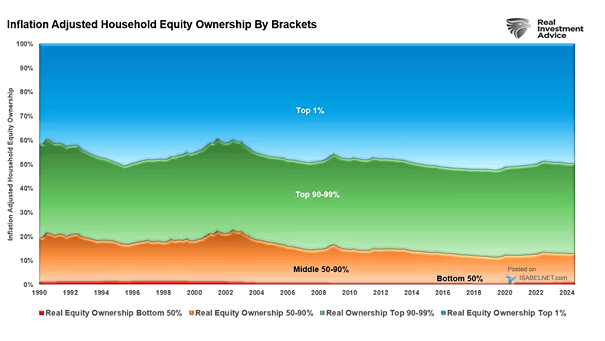
S&P 500 Earnings

S&P 500 Earnings The impressive returns of the S&P 500 over the past year have been largely driven by earnings, particularly from a handful of high-performing tech stocks. Image: BofA US Equity & Quant Strategy

Equities – China’s Valuations

Equities – China’s Valuations If the MSCI China P/E ratio increases from its current range of 11-12x to a peak of 15-16x, this could represent a potential upside of approximately 40%. Image: BofA Global Investment…

Percent of S&P 500 Market Cap Reporting Earnings

Percent of S&P 500 Market Cap Reporting Earnings With a significant number of S&P 500 companies set to report their earnings shortly, market participants will be closely monitoring these results for indications of economic health…

WTI Crude Oil to Gold Ratio

WTI Crude Oil to Gold Ratio Gold shines as the best-performing asset of 2024 for those looking for stability and inflation protection, while oil faces significant challenges from shifting demand patterns. Image: BofA Global Investment…

China as % of MSCI ACWI Market Capitalization

China as % of MSCI ACWI Market Capitalization Assuming that China’s market capitalization as a percentage of the MSCI ACWI rises to its 2018 high of 4.0%, this scenario presents a potential upside of approximately…

Number of Global Central Bank Rate Cuts

Number of Global Central Bank Rate Cuts Central banks globally are responding to slowing inflation and the need to stimulate economic growth by cutting interest rates at an unprecedented pace since the COVID-19 pandemic. Image:…

High-Yield (HY) Spread USD

High-Yield (HY) Spread USD Goldman Sachs forecasts a favorable high-yield bond market over the next 12 months, anticipating tighter spreads as a result of robust economic conditions and optimistic investor sentiment. Image: Goldman Sachs Global…

S&P 500 Returns After Five Month Win Streaks

S&P 500 Returns After Five Month Win Streaks Historically, the S&P 500 has shown bullish trends in the 12 months following five-month winning streaks, with an average increase of 10.6% in value observed since 1950.…

S&P 500 and the 28-Week Williams %R

S&P 500 and the 28-Week Williams %R The Williams %R indicator is an effective tool for identifying overbought and oversold conditions in financial markets. A sustained overbought condition may indicate a healthy market. Image: BofA…