
ISABELNET Cartoon of the Day
ISABELNET Cartoon of the Day Even in a bull market, where the S&P 500 gained 0.55% yesterday, it seems bears have opted for a long vacation rather than hibernation! Have a Great Day, Everyone! 😎
ISABELNET Cartoon of the Day Even in a bull market, where the S&P 500 gained 0.55% yesterday, it seems bears have opted for a long vacation rather than hibernation! Have a Great Day, Everyone! 😎
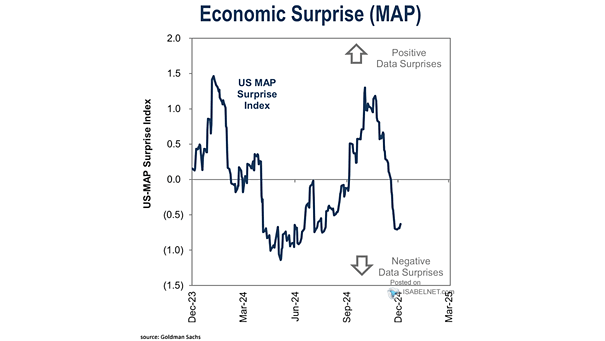
U.S. Economic Surprise Index A rising U.S. Economic Surprise Index is often associated with positive equity performance due to enhanced investor sentiment and expectations of continued economic growth. Image: Goldman Sachs Global Investment Research
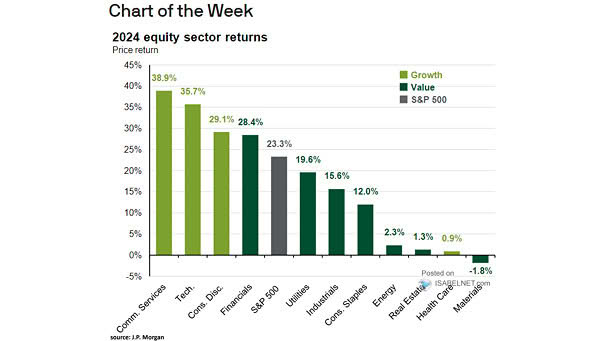
Equity Sector Returns While large-cap growth stocks, particularly those in the Magnificent 7, performed strongly in 2024, there was also a significant shift toward value sectors throughout the year, reflecting broader economic resilience. Image: J.P.…
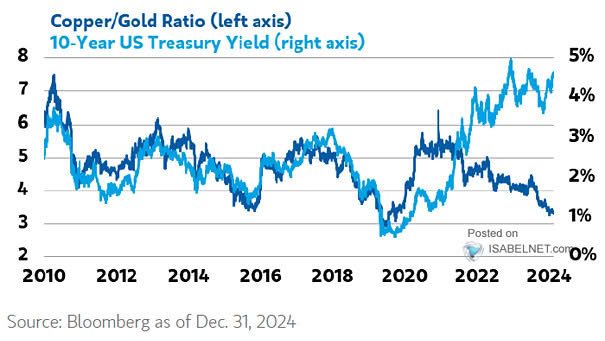
Copper to Gold Ratio and U.S. 10-Year Treasury Yield (Leading Indicator) The copper/gold ratio and the 10-year U.S. Treasury yield are showing signs of a persistent divergence. Image: Morgan Stanley Research
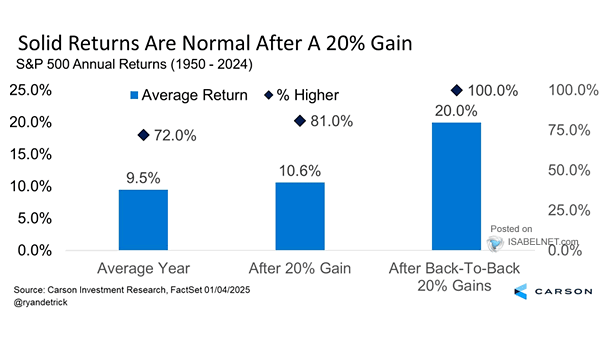
S&P 500 Annual Returns Bulls rejoice when the S&P 500 posts a 20% annual return. Historically, the following year has seen positive returns 81% of the time, with an average gain of 10.6% since 1950.…
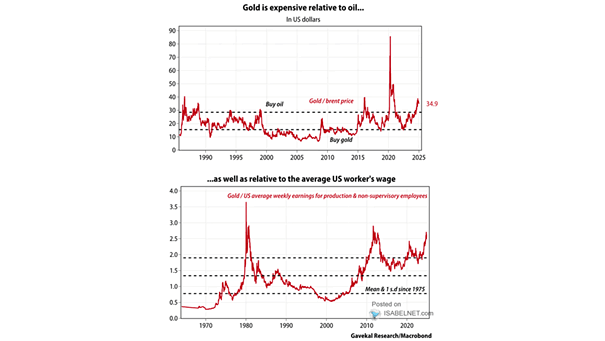
Gold While the outlook for gold remains bullish due to falling interest rates and sustained central bank purchases, it is currently viewed as expensive when compared to oil prices and the average wage of a…

ISABELNET Cartoon of the Day The S&P 500 is currently expensive, but trying to time the market based on valuations is like using a sundial at midnight—good luck with that! Still, bears are eager to…
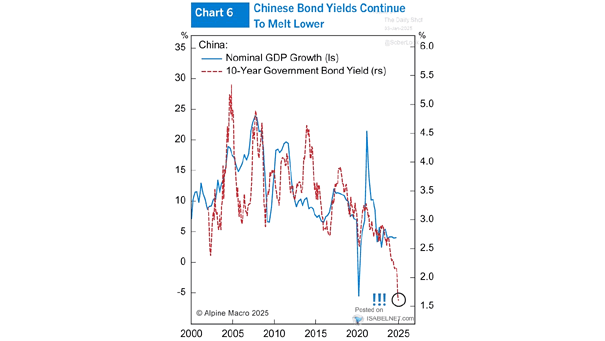
China – Nominal GDP Growth vs. 10-Year Government Bond Yield The persistent drop in bond yields is often seen as a sign of increasing investor caution regarding economic growth, which does not bode well for…
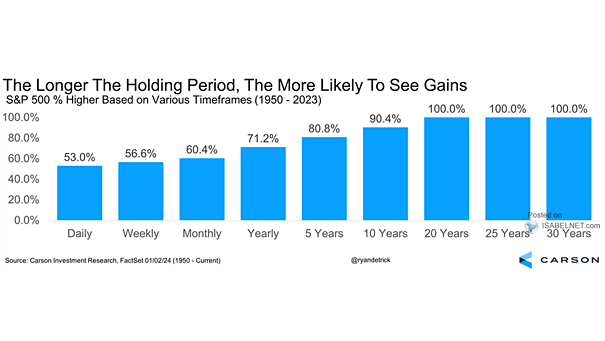
S&P 500 Index Returns Based on Various Timeframes Investors who hold positions in the S&P 500 for longer periods are more likely to achieve profitable returns and can better navigate the inherent volatility of the…
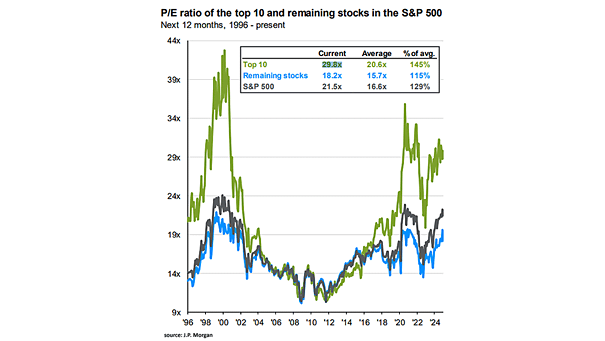
Valuation – P/E Ratio of the Top 10 and Remaining Stocks in the S&P 500 Investor concerns regarding the high valuation of the S&P 500 and its top 10 stocks are growing, particularly as historical…
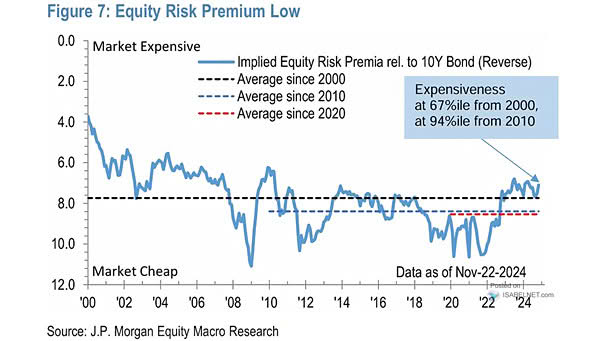
Equity Risk Premium The equity risk premium, at the 94th percentile from 2010 and at the 67th percentile from 2000, suggests that investors may not be receiving adequate compensation for the risks associated with investing…