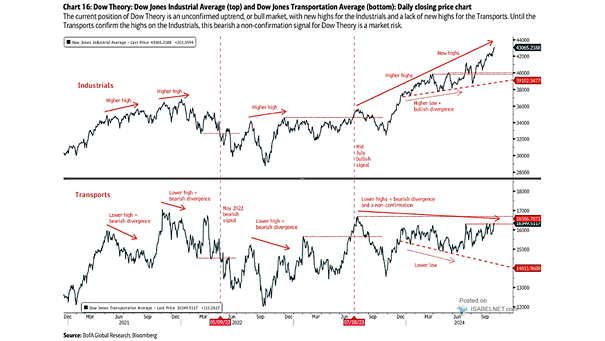
Distribution of 10-Year S&P 500 Annualized Returns
Distribution of 10-Year S&P 500 Annualized Returns Goldman Sachs projects a modest average annualized total return of 3% for the S&P 500 over the next decade, considerably below historical averages, reflecting concerns about high equity…