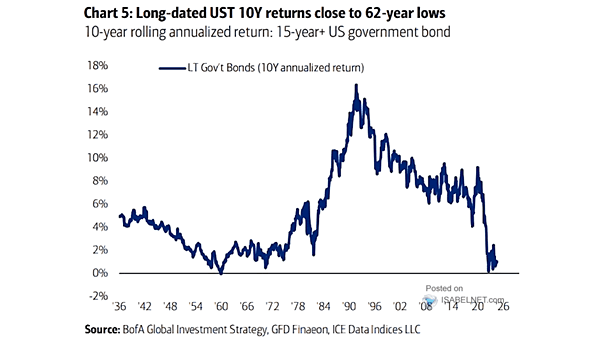
Nasdaq 100 Futures Positioning
Nasdaq 100 Futures Positioning While leveraged funds and asset managers are less bullish on Nasdaq 100 futures, they still maintain a net long position. Image: Deutsche Bank Asset Allocation
Valuation – S&P 500 Trailing 4Q P/E Bullish investors stay long until the trailing PE ratio of the S&P 500 exceeds 25x, signaling potential overvaluation and higher risk, prompting reassessment and defensive strategy shift. Image:…
Performance – Semiconductors vs. S&P 500 The relative outperformance of semiconductor stocks compared to the S&P 500 has surged to its highest level since March 2000, indicating a bullish momentum that bodes well for the…
Tech Stocks – G3 Central Bank Balance Sheet vs. Nasdaq 100 Will the divergence between central bank liquidity and tech stock performance continue through 2024? Image: BofA Global Investment Strategy
S&P 500 Price 20-Week Change Since the 1930s, there have been 10 instances of U.S. stocks gaining over 25% in just five months, demonstrating the market’s potential for rapid and significant growth in a relatively…
S&P 500 EPS Growth vs. Buyback Growth While EPS growth may be one factor influencing a company’s decision to repurchase its own shares, it is just one of many potential drivers of buyback activity. Image:…
Real Market Cap to GDP Ratio vs. Expected 10-Year Forward Returns The current elevated inflation-adjusted market capitalization to GDP ratio suggests the likelihood of anemic returns for the U.S. stock market over the next 10…
Tech Flows (Annual Inflows to Tech) The significant inflows into tech funds highlight investors’ continued interest in the sector’s growth and innovation potential. Image: BofA Global Investment Strategy
Return – Rolling 4-Month Percentage Change in the S&P 500 Index Does the fast rally in the S&P 500 reflect the characteristics of a bubble, especially when compared to the dot-com bubble? Image: Deutsche Bank
S&P 500 Performance After >20% Gain in 18 Weeks The S&P 500 index has historically shown strong performance after >20% gains in 18 weeks. On average, one year later, the index has increased in value…
Sentiment/VIX Composite vs. Fed Funds During a rate hiking campaign, bullish sentiment tends to increase initially, but ultimately ends badly. Image: Real Investment Advice