S&P 500 Down >4% Then Up >4% on Consecutive Weeks
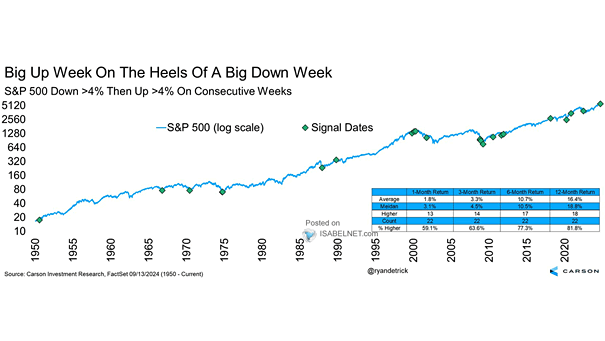
S&P 500 Down >4% Then Up >4% on Consecutive Weeks When the S&P 500 experiences a drop of more than 4% in one week followed by a rise of more than 4% the next week,…
S&P 500 Down >4% Then Up >4% on Consecutive Weeks When the S&P 500 experiences a drop of more than 4% in one week followed by a rise of more than 4% the next week,…
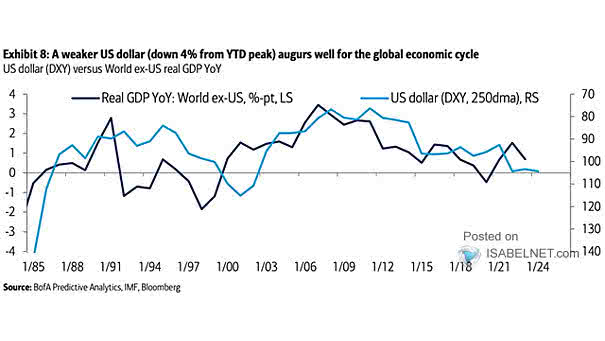
U.S. Dollar Index and Rest of the World GDP A weaker U.S. dollar typically bodes well for the global economy by boosting growth prospects, improving trade dynamics, and encouraging investment in international markets. Image: BofA…
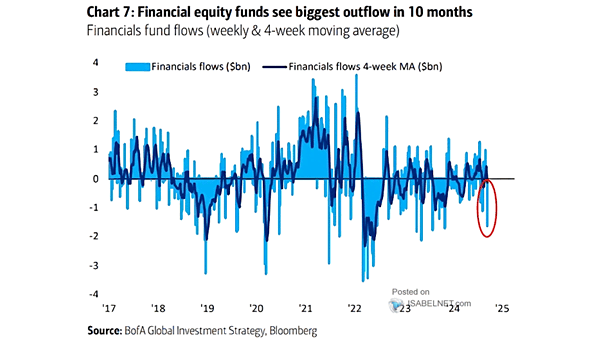
Weekly Financials Flows Outflows from financial equity funds highlight a cautious approach from investors, reflecting broader economic concerns and market volatility. Image: BofA Global Investment Strategy
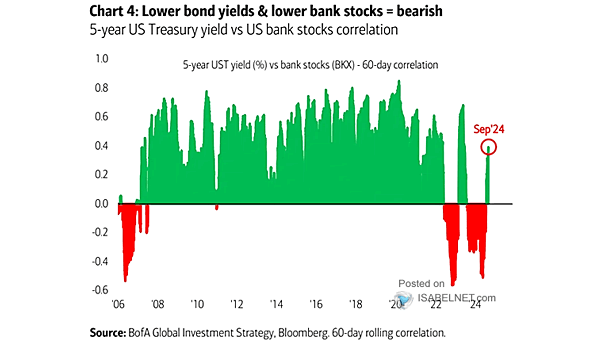
5-Year U.S. Treasury Yield vs. Bank Stocks Correlation The combination of higher bond yields and rising bank stocks is often often viewed as a sign of a bullish market environment. Image: BofA Global Investment Strategy
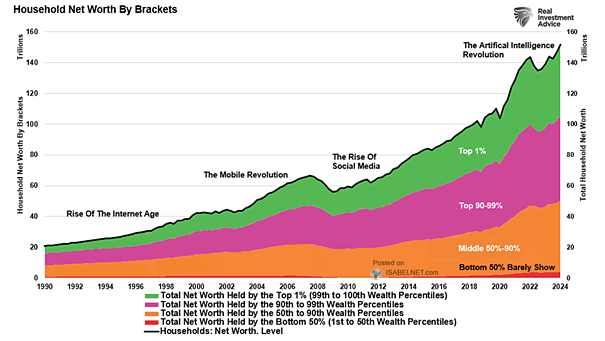
Inequality – U.S. Household Net Worth by Brackets The widening wealth gap in the U.S. reflects deep-rooted structural issues that have persisted for decades. While some groups have gained, the overall trend indicates a growing…
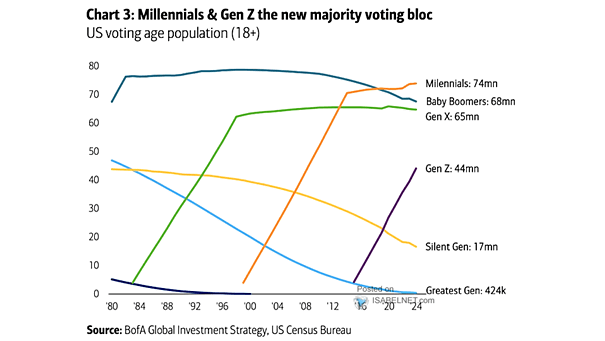
Elections – U.S. Voting Age Population Younger generations, specifically Millennials and Generation Z, are projected to become the new majority voting bloc in the upcoming 2024 U.S. presidential election, marking a significant generational shift in…
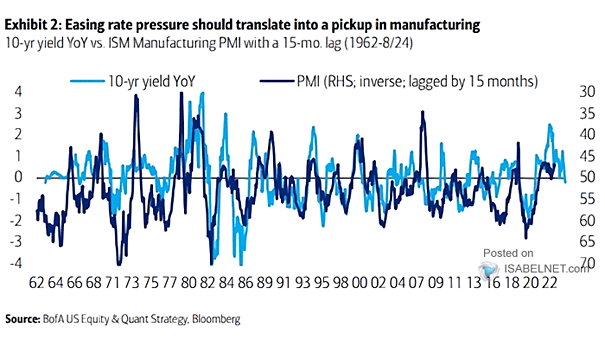
U.S. ISM Manufacturing PMI vs. 10-Year U.S. Treasury Yield Easing rate pressure is projected to facilitate a recovery in U.S. manufacturing as financial conditions improve, inflation declines, and both domestic and foreign demand strengthen. Image:…
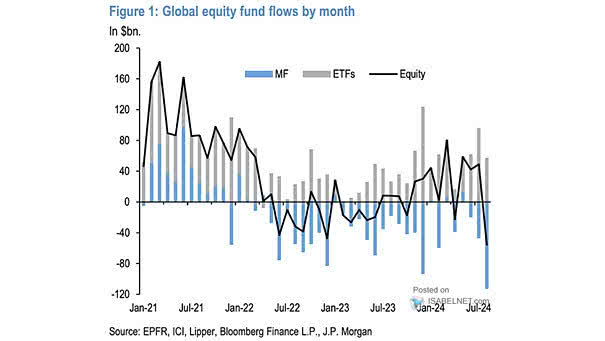
Global Equities Flows In August, global equity funds saw significant outflows, the largest since 2022, reflecting a cautious sentiment among investors. Image: J.P. Morgan
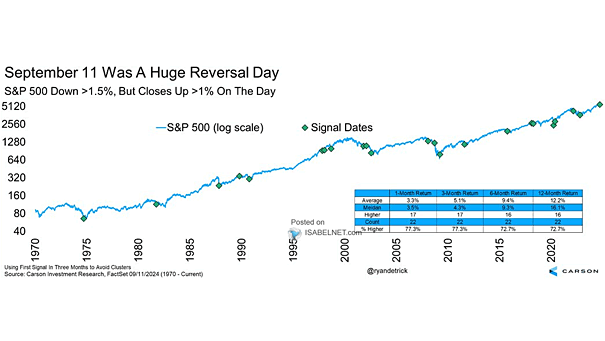
S&P 500 Down >1.5%, But Closes Up >1% on the Day Big reversal days, such as yesterday, have typically shown bullish trends in the U.S. stock market over the next 12 months, with a median…
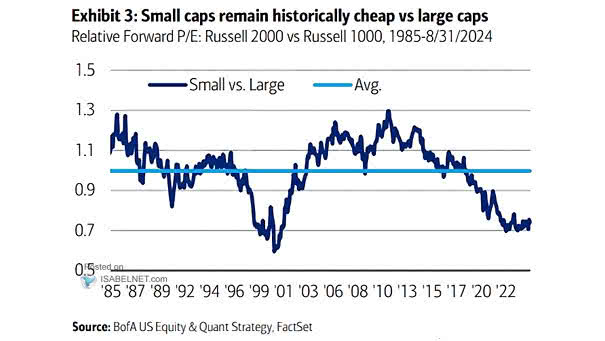
Valuation – Relative Forward P/E: Russell 2000 vs. Russell 1000 Small-caps may be an attractive option for long-term investors looking to diversify their investment portfolios, as they offer relatively cheaper valuations compared to large-caps. Image:…
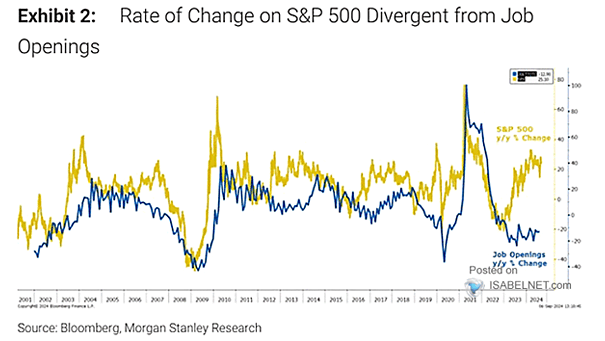
U.S. Job Openings and S&P 500 While job openings provide a snapshot of current economic conditions, the stock market reflects investor sentiment and expectations about the future. Image: BofA Global Investment Strategy