Inflation and Shipping Costs
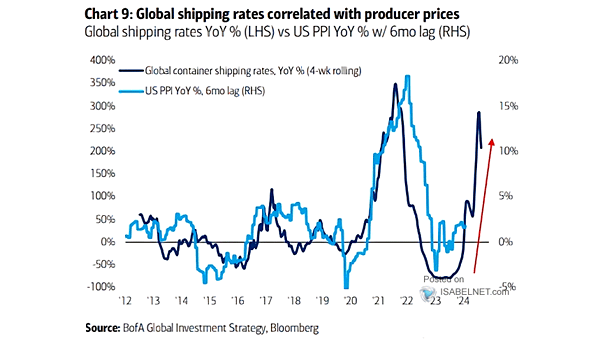
Inflation and Shipping Costs Global shipping rates usually lead producer prices by six months, indicating a potential rise in the Consumer Price Index in the near future. Image: BofA Global Investment Strategy
Inflation and Shipping Costs Global shipping rates usually lead producer prices by six months, indicating a potential rise in the Consumer Price Index in the near future. Image: BofA Global Investment Strategy
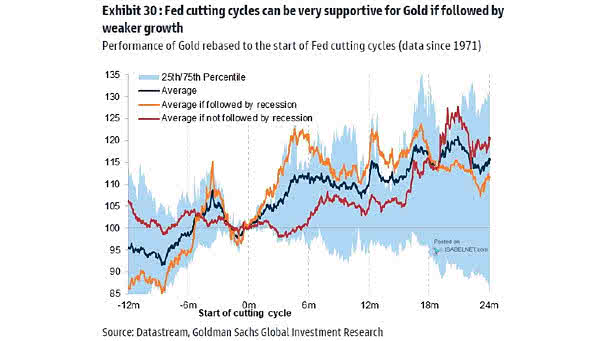
Performance of Gold and Fed Cutting Cycles Federal Reserve interest rate cuts are often perceived as favorable for gold prices, particularly during periods of economic downturn. Image: Goldman Sachs Global Investment Research
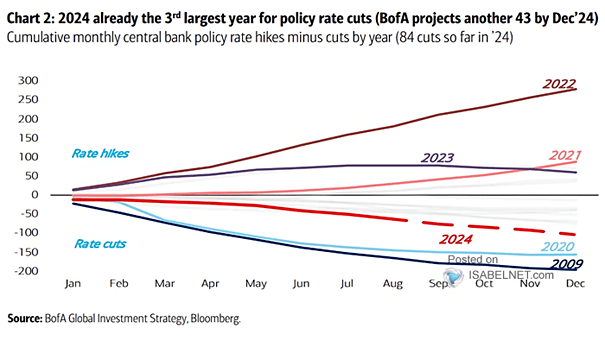
Interest Rates – Cumulative Rate Cuts vs. Hikes In 2024, global central banks are expected to implement significant policy rate cuts, marking it as the third largest year for such reductions in history, driven by…
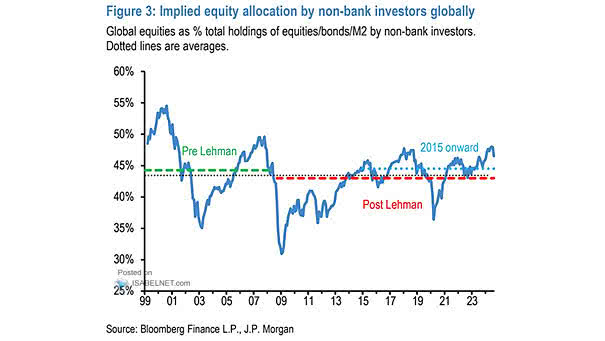
Implied Equity Allocation by Non-Bank Investors Globally Despite concerns about potential economic slowdowns, investors are currently maintaining an overweight position in global equities, suggesting a positive outlook for stock markets. Image: J.P. Morgan
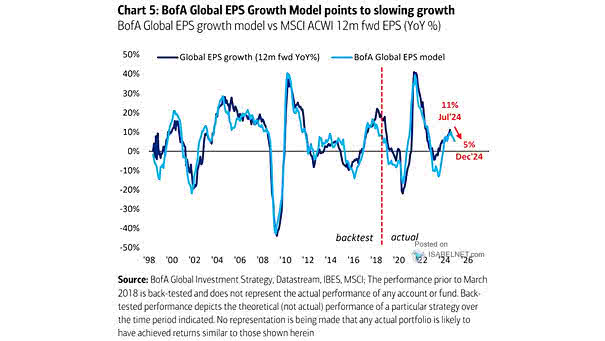
Global EPS Model vs. Consensus EPS BofA indicates a trend of slowing growth in its global earnings per share model, reflecting a shift toward a more cautious economic outlook. Image: BofA Global Investment Strategy
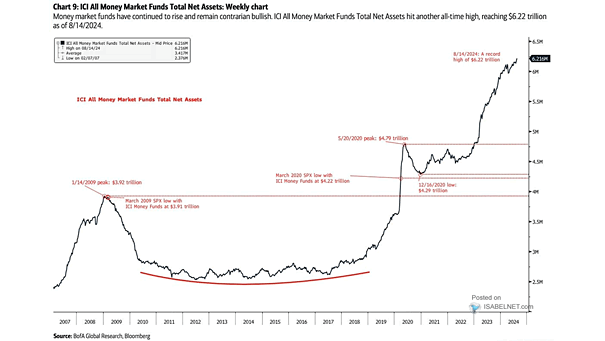
All Money Market Funds Total Net Assets Investors currently hold $6.22 trillion in money market funds, a figure that is being interpreted as contrarian bullish for the stock market. Image: BofA Global Research
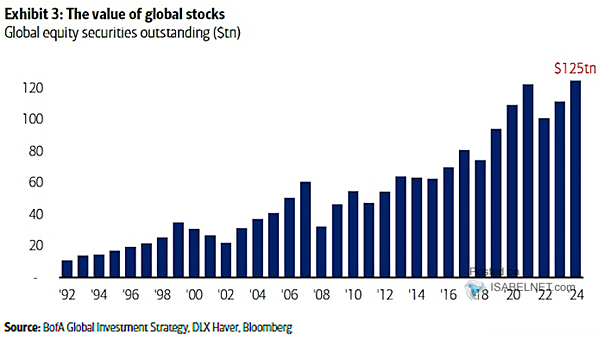
Global Stocks The value of global equities reached an all-time high of $125 trillion at the end of July 2024, driven by robust corporate earnings and investor confidence. Image: BofA Global Investment Strategy
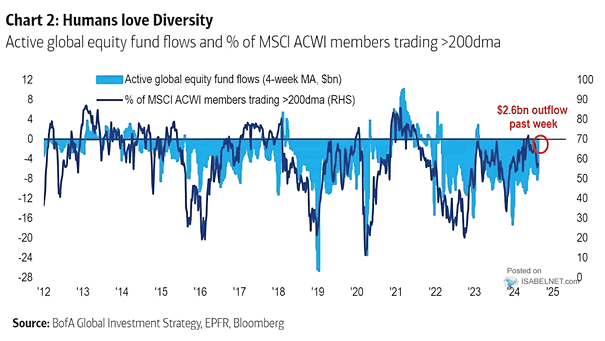
Active Global Equity Fund Flows and % MSCI ACWI Members Trading Above 200-DMA Flows to active global equity funds correlate strongly with stock price dispersion. Higher dispersion creates more opportunities for active managers, especially in…
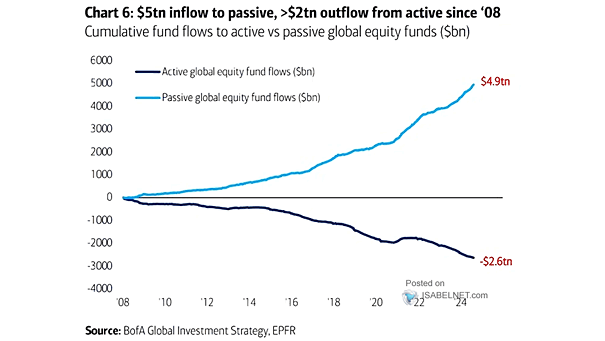
Cumulative Passive and Active Equity Flows While active equity funds have faced significant challenges, passive equity flows have shown resilience, remaining positive despite market fluctuations. Image: BofA Global Research
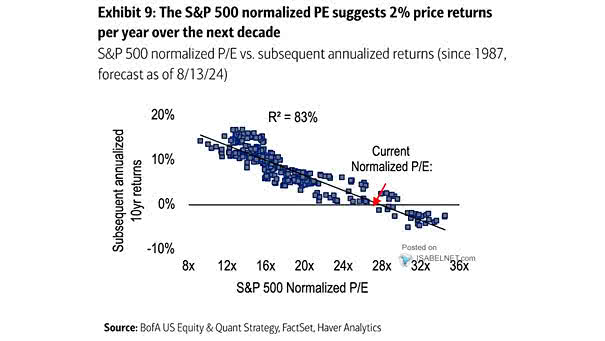
S&P 500 Normalized P/E vs. Subsequent Annualized Returns Current high valuations in the U.S. stock market, particularly within the technology sector, suggest that investors may face lackluster returns over the next decade. Image: BofA US…
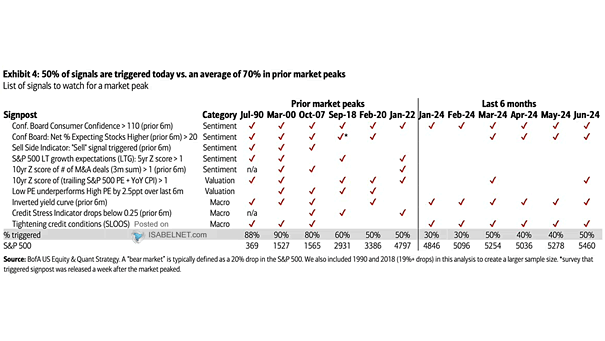
List of Signals to Watch for a Market Peak As of now, 50% of the 10 indicators for market peaks have been triggered, compared to an average of 70% during previous market peaks. This implies…