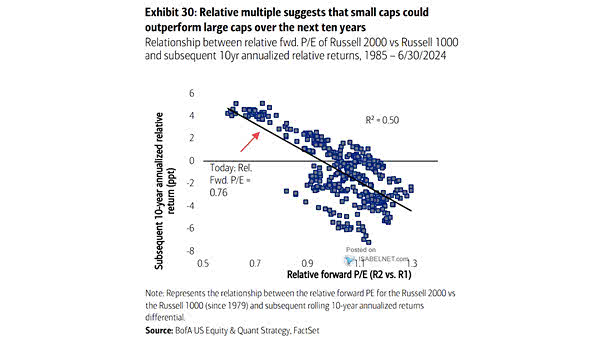
S&P 500 Price Returns by Year of Presidential Cycle

S&P 500 Price Returns by Year of Presidential Cycle While the fourth year of the presidential cycle has historically been favorable for the U.S. stock market, it tends to have lower returns compared to the…

Possible Scenarios for the S&P 500

Possible Scenarios for the S&P 500 According to Goldman Sachs forecasts, there is a 25% probability that the S&P 500 index will reach 5,000 by the end of 2024. Image: Goldman Sachs Global Investment Research

Russell 2000 Returns After Last Rate Hike

Russell 2000 Returns After Last Rate Hike Should equity investors favor U.S. small-cap stocks following the last Fed rate hike? Image: BofA Global Investment Strategy

FMS Investors Overweight Equities

FMS Investors Overweight Equities In the current market environment, FMS investors have a more positive outlook on equities. Image: BofA Global Fund Manager Survey

Top 5 Stocks as % of S&P 500 Market Capitalization

Top 5 Stocks as % of S&P 500 Market Capitalization The S&P 500 remains more concentrated in the five largest stocks than during the dotcom bubble, posing potential risks if these stocks underperform and raising…

Performance – Discretionary vs. S&P 500

Performance – Discretionary vs. S&P 500 U.S. consumer discretionary stocks are still trading 2 standard deviations above the long-term average relative to the S&P 500. Image: BofA Global Investment Strategy

Long Only Positioning in Value vs. Growth

Long Only Positioning in Value vs. Growth Value is still 53% underweight vs. Growth, highlighting a significant preference among investors for growth-oriented investments over value-based ones. Image: BofA US Equity & Quant Strategy

Fed Funds Target Rate

Fed Funds Target Rate Goldman Sachs predicts that by the end of 2024, the federal funds rate will reach 5.1%, which differs significantly from the expectations of the futures market.. Image: Goldman Sachs Global Investment…