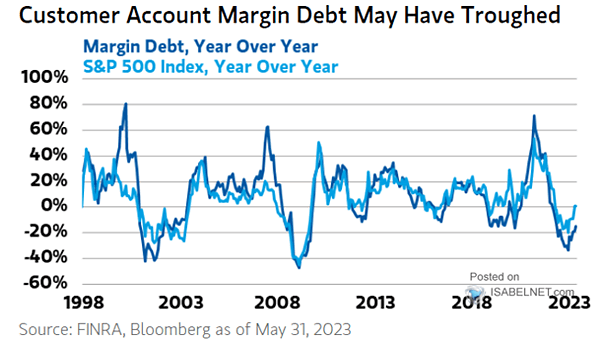
Seasonality – Monthly Return Stats for the S&P 500

Seasonality – Monthly Return Stats for the S&P 500 Historically, when May sees strong gains—over 5%—it often paves the way for continued positive sentiment and solid returns in June, especially when economic and monetary conditions…

Weekly Net Flow to U.S. Bitcoin and Gold ETFs

Weekly Net Flow to U.S. Bitcoin and Gold ETFs Over the past five weeks, U.S.-listed Bitcoin ETFs have attracted more than $9 billion, while gold-backed ETFs have seen outflows of $2.8 billion. This trend highlights…

U.S. Real GDP Growth

U.S. Real GDP Growth Goldman Sachs projects U.S. GDP growth of 1.5% in 2025 and 1.6% in 2026, both slightly above the consensus estimates of major forecasters. Image: Goldman Sachs Global Investment Research

S&P 500 Performance One Year After 5% Monthly Gains

S&P 500 Performance One Year After 5% Monthly Gains There’s very good news for bulls: Since 1950, whenever the S&P 500 has gained more than 5% in May, it has historically been higher 12 months…

U.S. ETF and Mutual Fund Flows

U.S. ETF and Mutual Fund Flows Investors are exhibiting a strong and sustained appetite for U.S. money market funds, driven by ongoing market volatility and persistently high short-term interest rates. Image: Goldman Sachs Global Investment…

S&P 500 Drawdown in DXY Dollar Index

S&P 500 Drawdown in DXY Dollar Index The U.S. equity drawdown has caused major losses for non-U.S. investors, as falling stock prices and a weaker dollar combined. This has prompted many to reconsider their currency…

U.S. Current Activity Indicator

U.S. Current Activity Indicator U.S. soft data and growth signals have improved slightly, largely due to a more favorable trade policy outlook following the partial rollback of tariffs. Image: Goldman Sachs Global Investment Research

S&P 500 Performance

S&P 500 Performance The S&P 500 is poised for its best monthly performance since July 2023, marking a significant turnaround and defying the old “sell in May and go away” adage. Image: Bloomberg