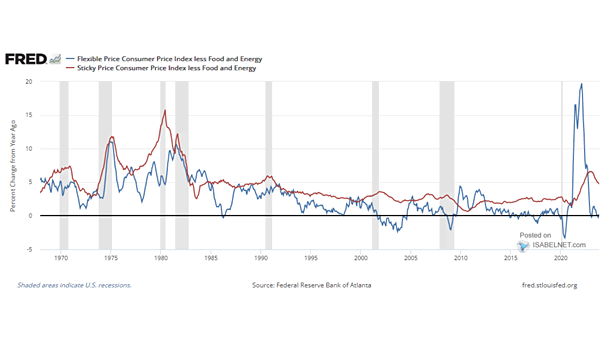
S&P 500 Index Valuation vs. Fed Funds Rate

S&P 500 Index Valuation vs. Fed Funds Rate Given that much of the stock market’s progress this year can be attributed to valuation expansion, it is likely that U.S. stocks will eventually experience a correction…

S&P 500 6-Month Seasonality

S&P 500 6-Month Seasonality November through April is considered the optimal 6-month period for the S&P 500, as historical analysis suggests stronger performance compared to the other six months of the year. Image: BofA Global…

10-Year U.S. Treasury Yield Less CPI

10-Year U.S. Treasury Yield Less CPI Given investors’ historic tendency to demand a 200 basis point premium over inflation rates, could rates rise further? Image: Morgan Stanley Wealth Management

Importance of Macro Driver in Explaining Returns

Importance of Macro Driver in Explaining Returns Higher real 10-year UST yields can potentially lead to a decrease in U.S. stock returns, but other factors should also be considered. Image: Goldman Sachs Global Investment Research

U.S. Equity Risk Premium – Long-Term View

U.S. Equity Risk Premium – Long-Term View Should investors approach U.S. equities with caution due to the significant decline in the equity risk premium, which stands well below its historical average? Image: Topdown Charts

S&P 500 When Up 10% or More at the End of June

S&P 500 When Up 10% or More at the End of June The sell-off in U.S. stocks may not imply a long-lasting bearish period, but rather a temporary dip that could reverse in late October,…

S&P 500 Performance After a Year of No Record Highs

S&P 500 Performance After a Year of No Record Highs From a historical perspective, the absence of a record high in the S&P 500 Index since the start of the year could indicate the possibility…

Global Central Bank Balance Sheets

Global Central Bank Balance Sheets The ongoing trend of central banks purchasing global debt since 2008, will depend on dynamic economic conditions, inflationary forces, and the specific monetary policy goals of each individual central bank.…

Cycle – U.S. Regimes

Cycle – U.S. Regimes The U.S. regime indicator remains in the recovery phase, which suggests that there are positive signs and trends indicating improvement. Image: BofA US Equity & Quant Strategy

S&P 500 Average 10-Day Returns

S&P 500 Average 10-Day Returns Historically, U.S. stocks are entering a seasonally bullish period, associated with positive performance and upward momentum. Image: Carson Investment Research