U.S. Real GDP “New-New Normal”
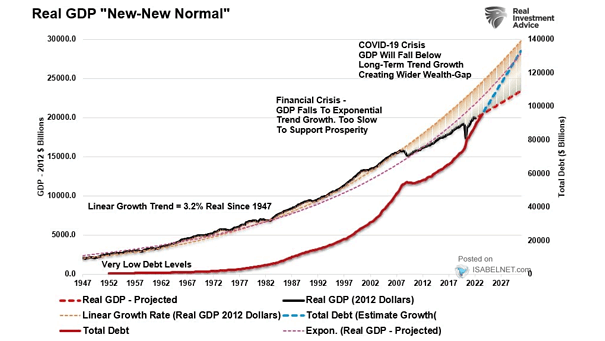
U.S. Real GDP “New-New Normal” Will a sustained period of low economic growth be the “new normal” for the United States? Image: Real Investment Advice
U.S. Real GDP “New-New Normal” Will a sustained period of low economic growth be the “new normal” for the United States? Image: Real Investment Advice
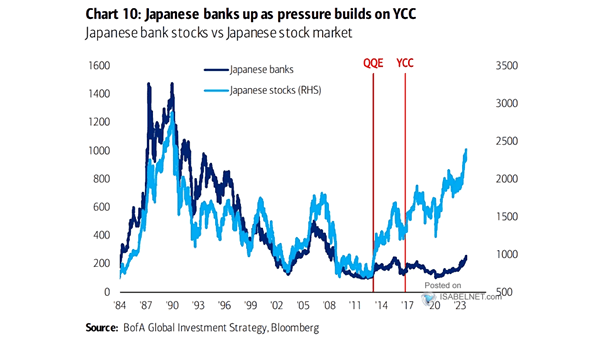
Japanese Banks Stock Price Index vs. Japanese Stocks Given the increase in Japanese government bond yields, should investors favor Japanese bank stocks? Image: BofA Global Investment Strategy
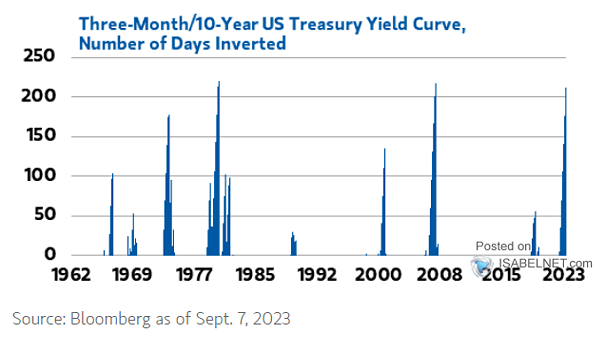
Consecutive Trading Days of Inverted 10Y-3M U.S. Treasury Yield Curve The inversion of the 10Y-3M UST yield curve typically reflects market expectations of slower economic growth and potentially lower interest rates in the future. Image:…
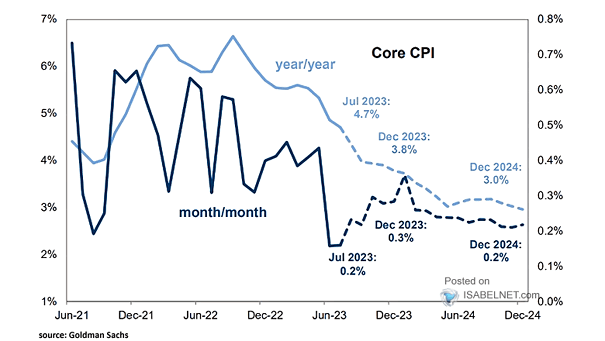
Inflation – U.S. Core CPI Goldman Sachs forecasts that U.S. core CPI will be 3.0% in December 2024. Image: Goldman Sachs Global Investment Research
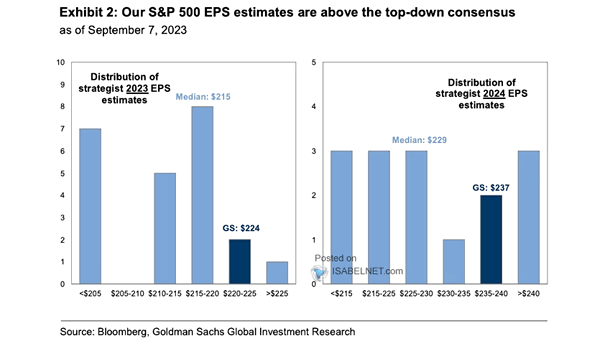
S&P 500 EPS Estimates Goldman Sachs is more optimistic than consensus on EPS estimates for 2023 and 2024. Image: Goldman Sachs Global Investment Research
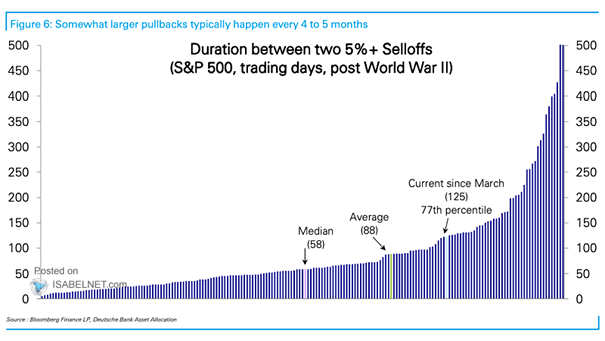
S&P 500 – Duration Between 5%+ Selloffs 5%+ selloffs in the U.S. stock market have occured within 88 trading days on average since World War II. Image: Deutsche Bank Asset Allocation
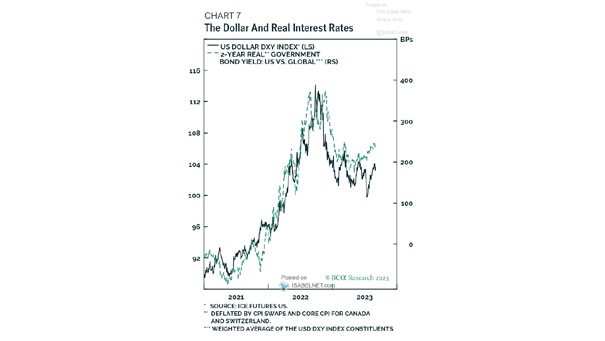
U.S. Dollar vs. Real Interest Rates Higher real interest rate differentials between the United States and the world are generally associated with a stronger U.S. dollar. Image: BCA Research
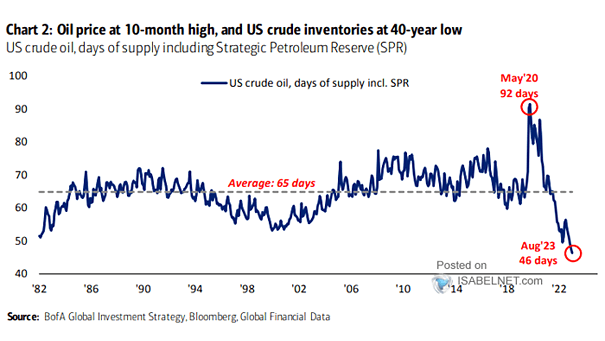
U.S. Crude Oil The U.S. days of crude oil supply, including the Strategic Petroleum Reserve (SPR), have decreased to 46 days, which is a 40-year low. Image: BofA Global Investment Strategy
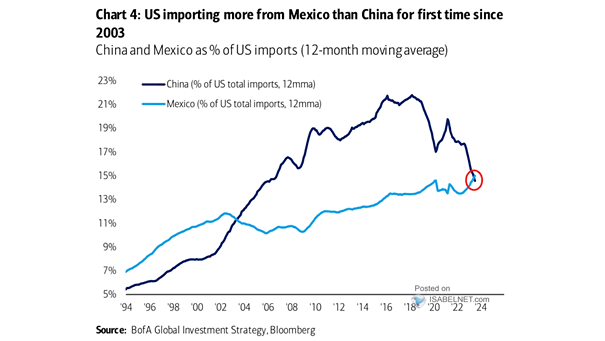
China and Mexico as % of U.S. Imports For the first time since 2003, the United States currently imports more goods from Mexico than from China. Will this trend continue? Image: BofA Global Investment Strategy
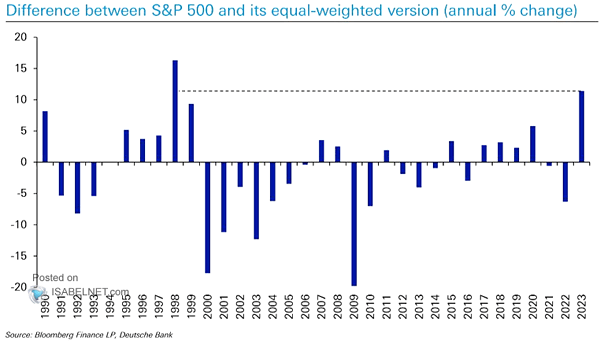
Performance – Percentage Point Difference between S&P 500 and Equal-Weighted S&P 500 Annual Price Moves The outperformance of the S&P 500 vs. the S&P 500 equal-weighted is the biggest since 1998. Image: Deutsche Bank
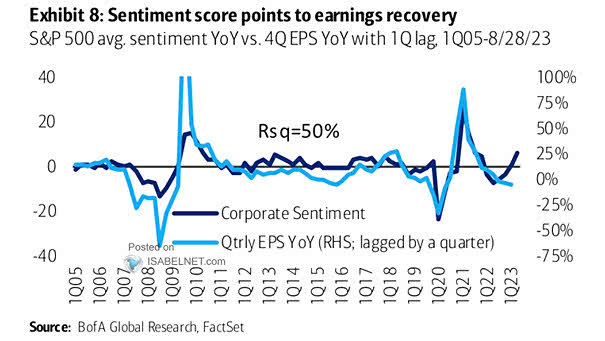
S&P 500 Average Negative Sentiment Score YoY vs. Quarterly EPS YoY (Leading Indicator) The significant increase in corporate sentiment indicates a potential recovery in earnings, which is good news. Image: BofA Global Research