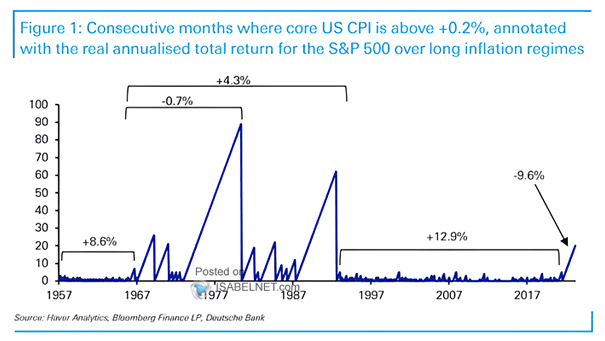
Commodities – Global Manufacturing Output PMI vs. Bloomberg Commodity Index
Commodities – Global Manufacturing Output PMI vs. Bloomberg Commodity Index Will commodity prices decline in 2023 amid slowing global demand? Image: TS Lombard
U.S. Existing Home Sales High mortgage rates do not bode well for existing home sales in the United States. Image: BofA Global Research
U.S. ISM New Orders vs. S&P 500 NTM EPS Growth (Leading Indicator) Should U.S. equity investors expect -10% earnings growth in 2023? Image: KKR & Co.
Global Monetary Policy Map So far, global central banks remain firmly in a tightening mode. Image: Topdown Charts
Valuation – Long History of U.S. P/E The S&P 500 still does not look cheap despite a lower valuation. Image: Goldman Sachs Global Investment Research Click the Image to Enlarge
U.S. Market Concentration Indicator U.S. market concentration has declined substantially. Image: Alpine Macro
Net % of FMS Investors Expecting Stronger Economy FMS investors expect a weaker economy in the next 12 months. Are FMS economy expectations too pessimistic? Image: BofA Global Fund Manager Survey
Volatility – Average VIX vs. Short-Term Rates Levels VIX is expected to remain high in 2023. Image: J.P. Morgan Equity Derivatives Strategy
U.S. ISM Manufacturing Index vs. U.S. 30-Year Mortgage Rate YoY Change The U.S. 30-year mortgage rate YoY change tends to lead the U.S. ISM Manufacturing Index by 19 months. Image: UnderOrion and Macrobond
FMS Investors – Net % Say They Are Overweight Emerging Market Equities Should investors overweight emerging market equities in 2023? Image: BofA Global Fund Manager Survey
History of the U.S. Dollar This chart highlights the rise and fall of the U.S. dollar since 1973. Image: Goldman Sachs Global Investment Research Click the Image to Enlarge