Would You Rather Be Long or Short S&P 500 Volatility at the Moment?
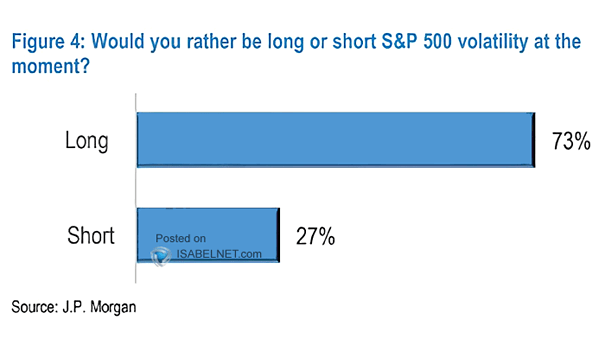
Would You Rather Be Long or Short S&P 500 Volatility at the Moment? 73% of JPM clients prefer to be long S&P 500 volatility right now. Image: J.P. Morgan
Would You Rather Be Long or Short S&P 500 Volatility at the Moment? 73% of JPM clients prefer to be long S&P 500 volatility right now. Image: J.P. Morgan
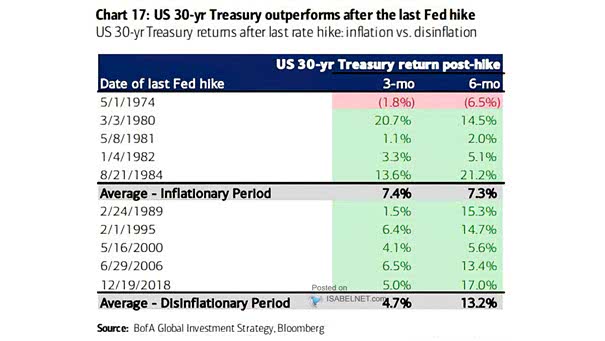
U.S. 30-Year Treasury Returns After Last Rate Hike The U.S. 30-year Treasury tends to outperform in the three and six months following the last Fed rate hike. Image: BofA Global Investment Strategy
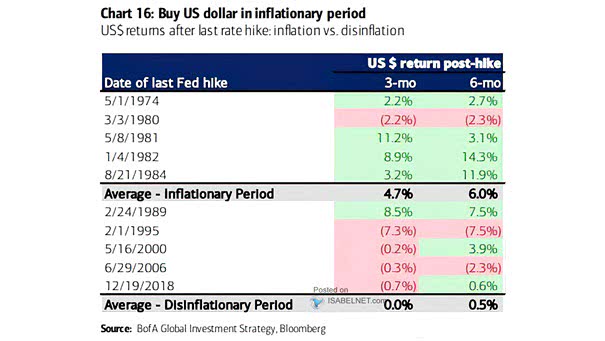
U.S. Dollar Returns After Last Rate Hike In inflationary periods, the U.S. dollar tends to rise in the three and six months following the last Fed rate hike. Image: BofA Global Investment Strategy
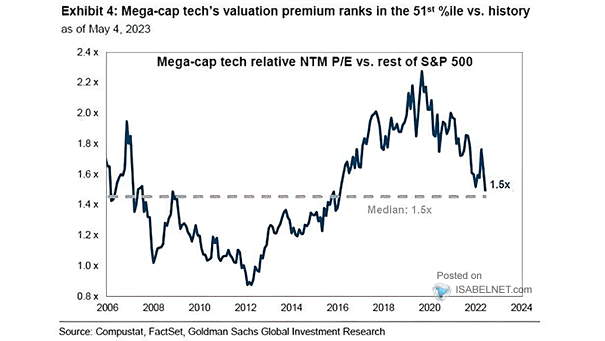
Valuation – Mega-Cap Tech Relative NTM P/E vs. Rest of S&P 500 The concentration of mega-cap tech stocks in the S&P 500 Index has raised concerns that the market is being pulled up by a…
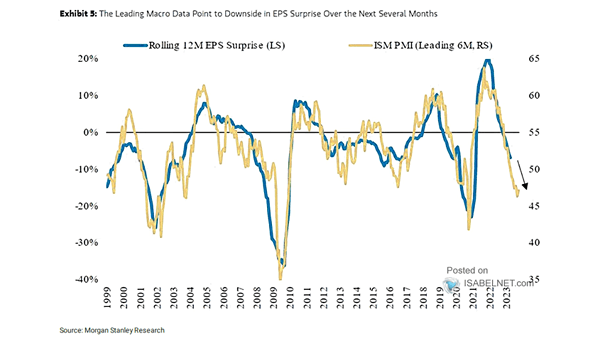
Rolling 12-Month EPS Surprise vs. ISM PMI Are markets too optimistic? Image: Morgan Stanley Research
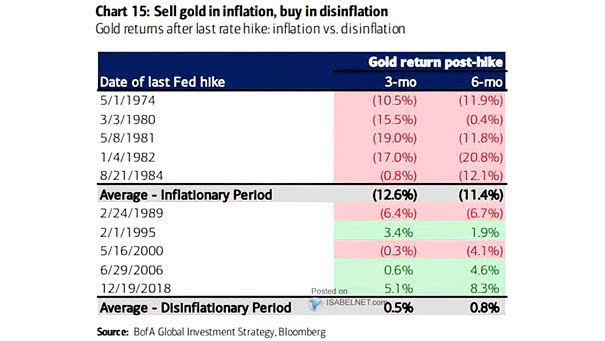
Gold Returns After Last Rate Hike Should investors sell gold after the last Fed rate hike? Image: BofA Global Investment Strategy
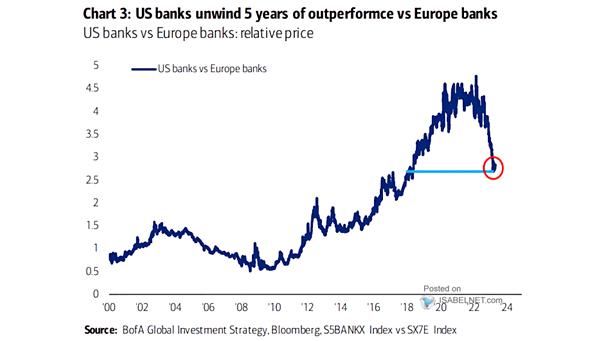
Performance – U.S. Banks vs. Europe Banks Can European banks continue to outperform U.S. banks in 2023? Image: BofA Global Investment Strategy
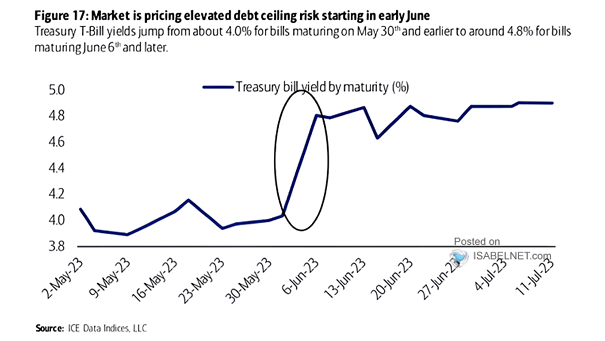
U.S. Treasury Bill Yield by Maturity A default by the U.S. government could have significant negative effects on the economy, including financial market disruptions and a loss of faith in the United States by international…
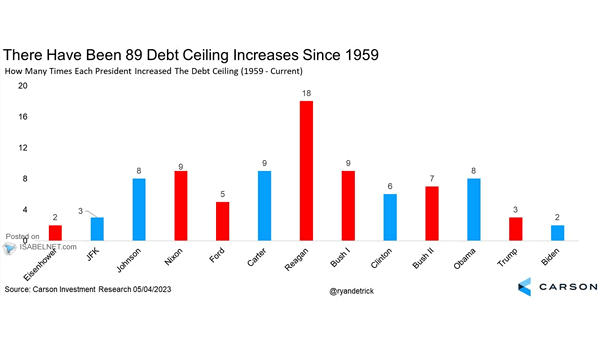
How Many Times Each President Increased the Debt Ceiling? The U.S. debt ceiling has been raised 89 times since 1959. Is this time any different? Image: Carson Investment Research
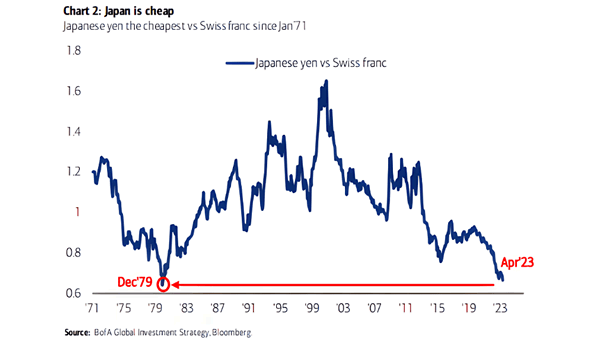
Japanese Yen vs. Swiss Franc The Japanese yen looks cheap against the Swiss franc. Image: BofA Global Investment Strategy
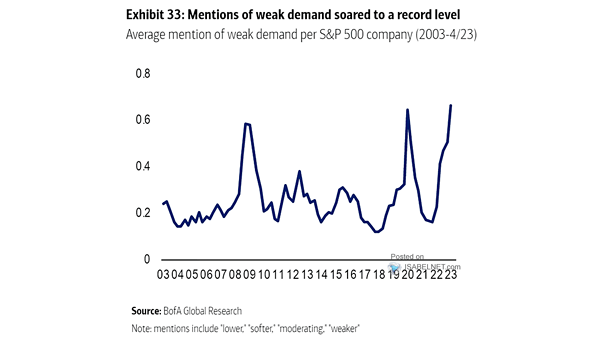
Average Mention of Weak Demand per S&P 500 Company Mentions of weak demand during earnings calls are rising to a record level, which is not good news. Image: BofA Global Research