S&P 500 Total Return vs. USD Liquidity Proxy
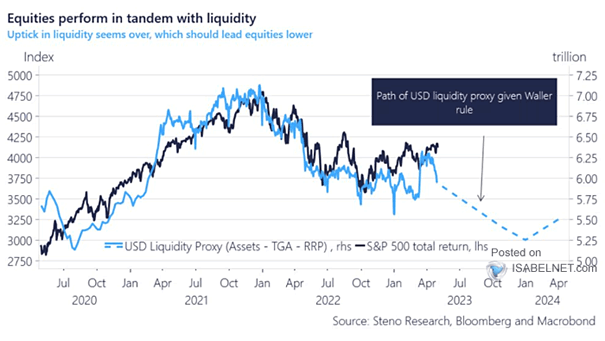
S&P 500 Total Return vs. USD Liquidity Proxy The U.S. liquidity outlook will be a headwind for U.S. stocks in the coming quarters. Image: Steno Research
S&P 500 Total Return vs. USD Liquidity Proxy The U.S. liquidity outlook will be a headwind for U.S. stocks in the coming quarters. Image: Steno Research
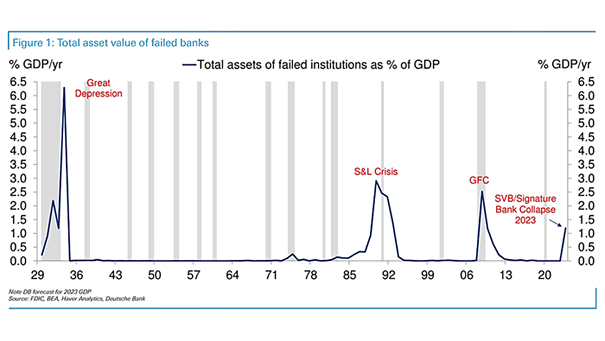
Total Assets of Failed Institutions as % of GDP What will be the impact of bank failures on the U.S. economy? Image: Deutsche Bank
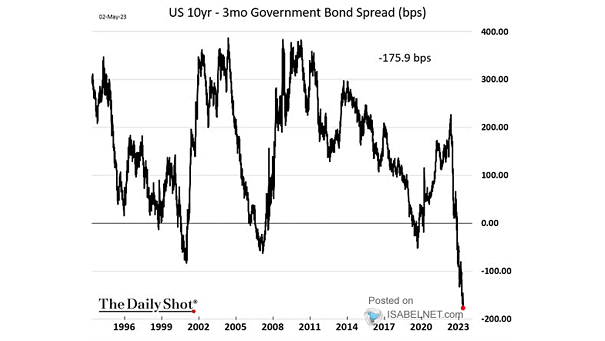
Yield Curve – U.S. 10-Year – 3-Month Treasury Spread So far, the inversion of the U.S. 10Y-3M yield curve continues to deepen. Image: The Daily Shot
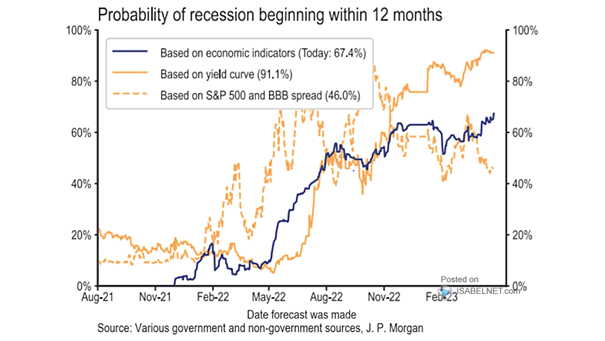
Probability of U.S. Recession Beginning Within 12 Months The probability of a U.S. recession beginning within 12 months remains high. Image: J.P. Morgan
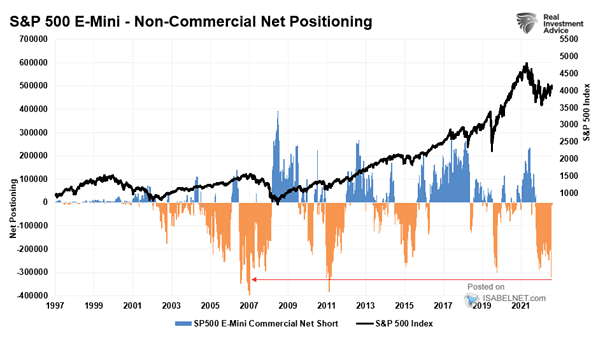
S&P 500 E-Mini – Non-Commercial Net Positioning There is a massive short position building up against the S&P 500. Image: Real Investment Advice
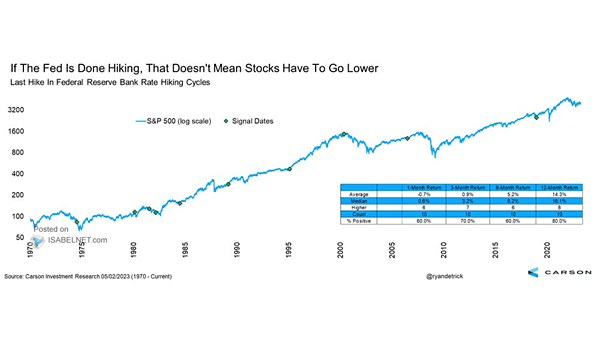
S&P 500 and Last Hike in Federal Reserve Bank Rate Hiking Cycles The last Fed rate hike is not necessarily bearish for U.S. stocks over the next 12 months. Image: Carson Investment Research
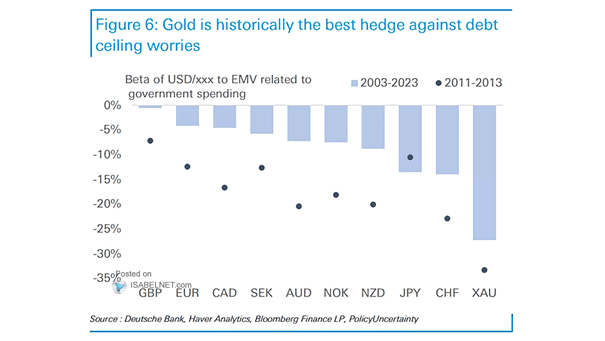
Gold – Beta of USD/xxx to Equity Market Volatility Related to Government Spending Gold has been a very good hedge against debt ceiling worries in the past. Image: Deutsche Bank
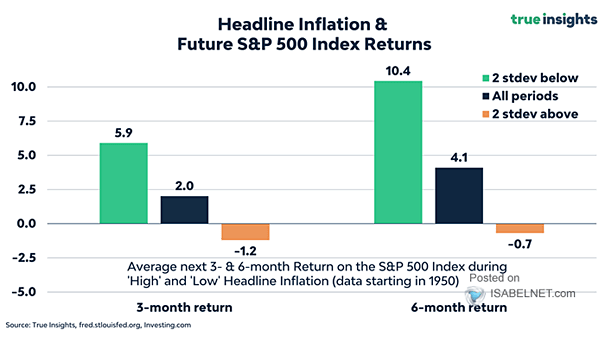
Headline Inflation and Future S&P 500 Index Returns When inflation is high, future returns on U.S. equities tend to be lower than average. Image: True Insights
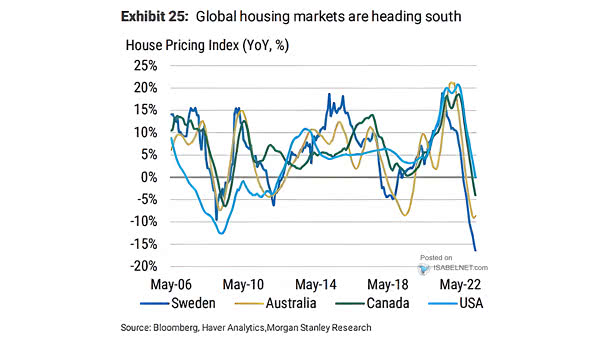
House Pricing Index Rising borrowing costs and interest rates are impacting global housing markets and driving down prices in many developed markets. Image: Morgan Stanley Research
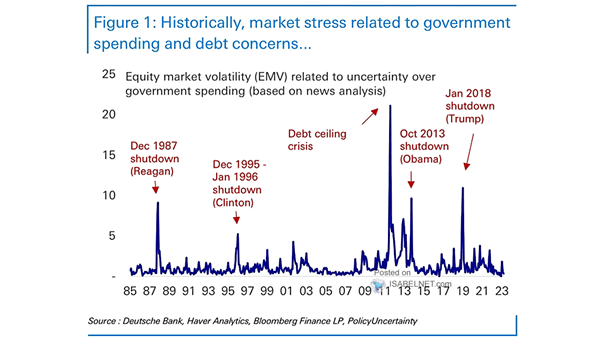
Equity Market Volatility Related to Uncertainty over Government Spending Equity market volatility may spike when the debt ceiling is under discussion. Image: Deutsche Bank
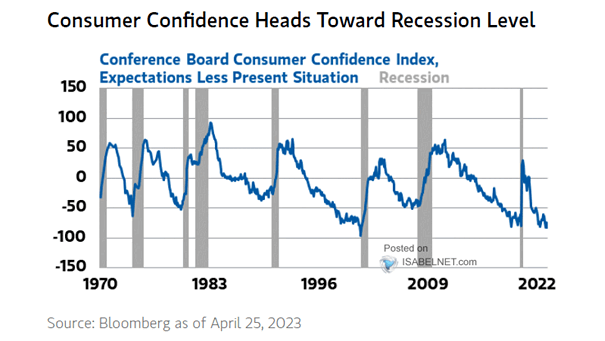
Recessions and Conference Board Consumer Confidence Index Expectations Less Present Situation Historically, low consumer confidence expectations have not been a positive sign for the U.S. economy. Image: Morgan Stanley Wealth Management