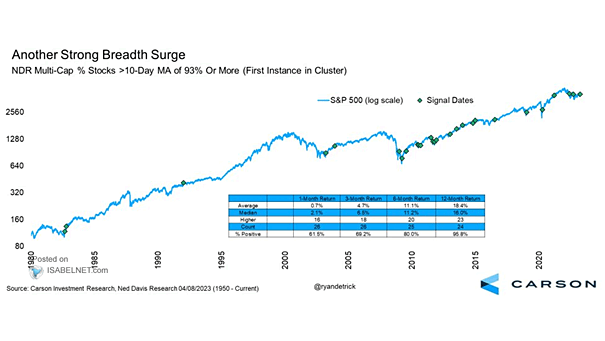
S&P 500 and 200-Week Moving Average

S&P 500 and 200-Week Moving Average Historically, the 200-week moving average tends to be a strong support level for the S&P 500 until a recession occurs in the United States. Image: Morgan Stanley Research

Resources (Energy + Materials) Flows

Resources (Energy + Materials) Flows Will resources (energy + materials) continue to experience inflows? Image: BofA Global Investment Strategy

Global CPI Inflation

Global CPI Inflation Global inflation is expected to decline substantially in 2023. Image: Morgan Stanley Research

IG + HY + EM Debt Flows

IG + HY + EM Debt Flows Flows into IG/HY/EM debt have turned positive. Image: BofA Global Research

U.S. Market Cycle Indicators

U.S. Market Cycle Indicators Will the % of market cycle indicators be less than 30% in the next 12 months? Image: Richardson Wealth