FMS Investors – Net % Overweight Banks
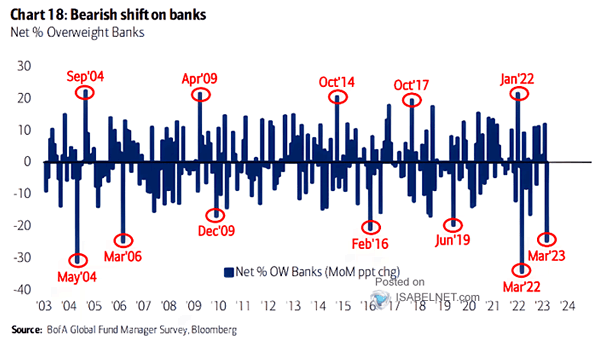
FMS Investors – Net % Overweight Banks FMS investors are bearish on banks, while most banks are in very good shape. Image: BofA Global Fund Manager Survey
FMS Investors – Net % Overweight Banks FMS investors are bearish on banks, while most banks are in very good shape. Image: BofA Global Fund Manager Survey
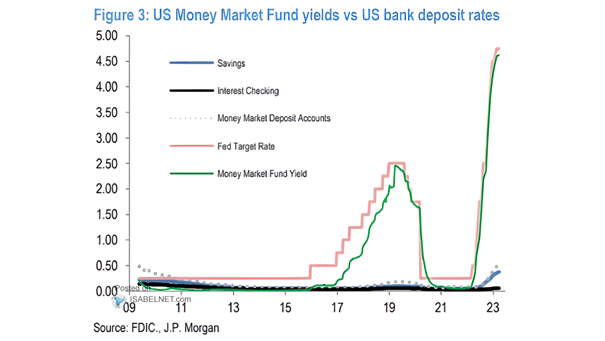
U.S. Money Market Fund Yields vs. U.S. Bank Deposit Rates Higher rates could lead to deposit flight and increased liquidity risk for U.S. banks. Image: J.P. Morgan
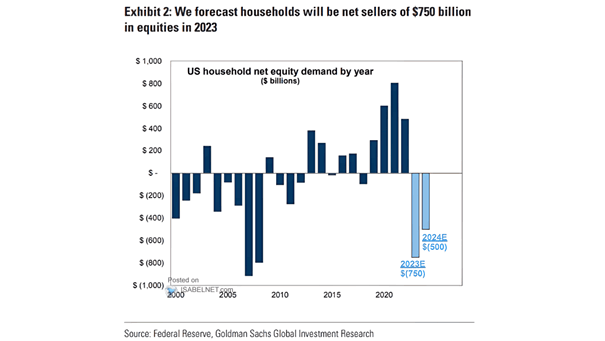
U.S. Household Net Equity Demand by Year U.S. households’ demand for equities could be a headwind for stocks. Image: Goldman Sachs Global Investment Research
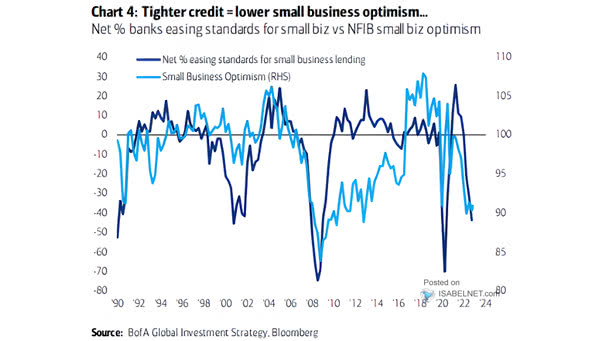
Net % Bank Easing Standards for Small Business vs. NFIB Small Business Optimism Tighter lending standards have an impact on small business optimism. Image: BofA Global Investment Strategy
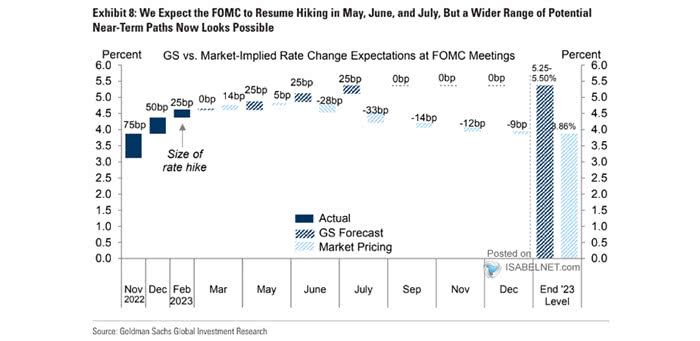
Fed – Rate Hikes at FOMC Meetings When will the Fed stop hiking interest rates? Goldman Sachs expects 75bp additional rate hikes in 2023. Image: Goldman Sachs Global Investment Research
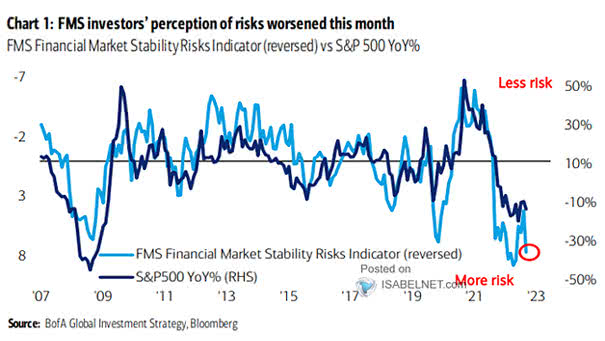
FMS Financial Market Stability Risks Index vs. S&P 500 Financial market stability risks continue to weigh on the S&P 500. Image: BofA Global Fund Manager Survey
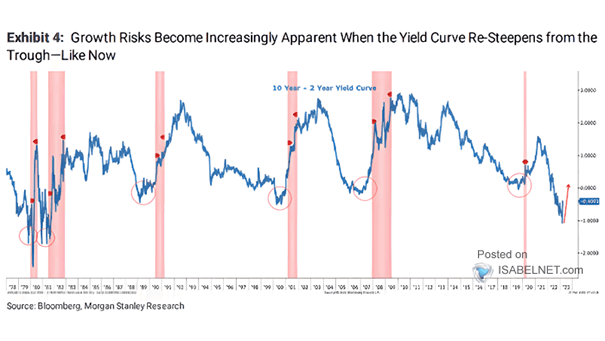
U.S. 10-Year – 2-Year Yield Curve Historically, the re-steepening of the U.S. 10Y-2Y yield curve from the trough has preceded recessions. Image: Morgan Stanley Research
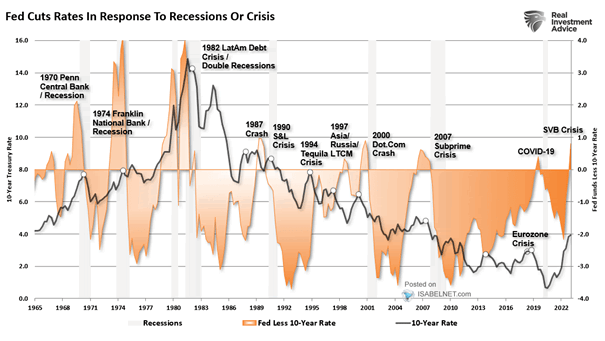
Fed Cuts Rates in Response to Recessions or Crisis Historically, a recession or a financial crisis tends to occur when the federal funds rate is above the 10-year yield. Image: Real Investment Advice
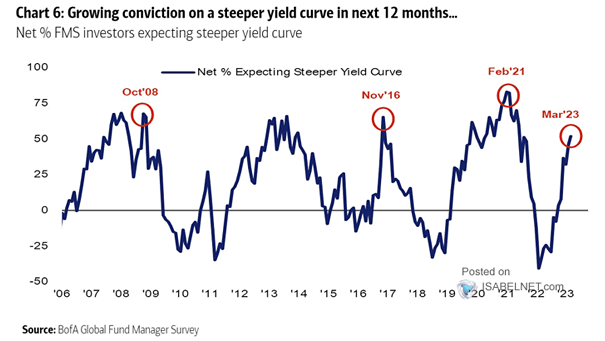
FMS Investors – Net % Expecting Steeper Yield Curve Yield curve steepening expectations have increased. Image: BofA Global Fund Manager Survey
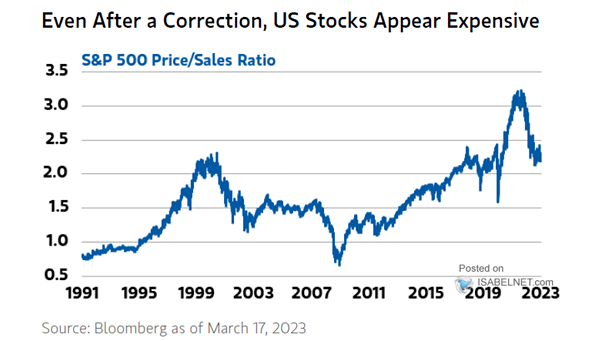
Valuation – S&P 500 Index Price-to-Sales Ratio U.S. equities remain expensive by historical standards, despite the correction. Image: Morgan Stanley Wealth Management
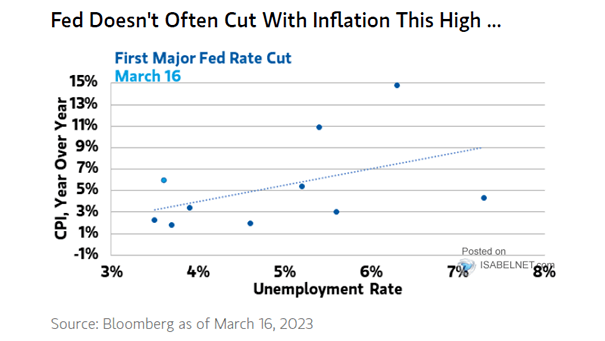
First Major Fed Rate Cut – U.S. CPI vs. Unemployment Rate Can the Fed cut interest rates in response to the bank crisis? Image: Morgan Stanley Wealth Management