Financials and Banking Exposure by Index
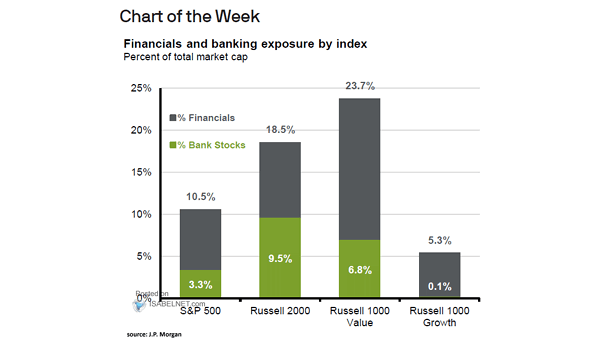
Financials and Banking Exposure by Index The Russell 2000 has more exposure to financial stocks (18.5%) than the S&P 500 (10.5%). Image: J.P. Morgan Asset Management
Financials and Banking Exposure by Index The Russell 2000 has more exposure to financial stocks (18.5%) than the S&P 500 (10.5%). Image: J.P. Morgan Asset Management
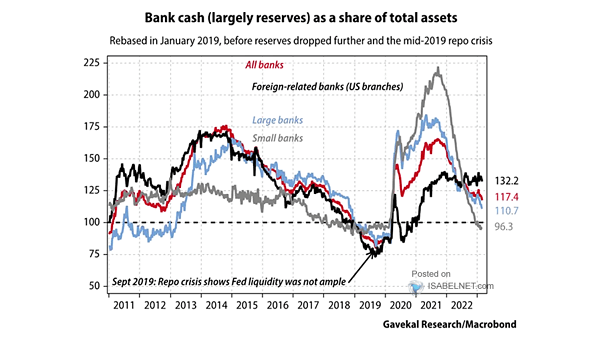
Bank Cash As a Share of Total Assets U.S. banks have plenty of cash on hand and most banks are in very good shape. Image: Gavekal, Macrobond
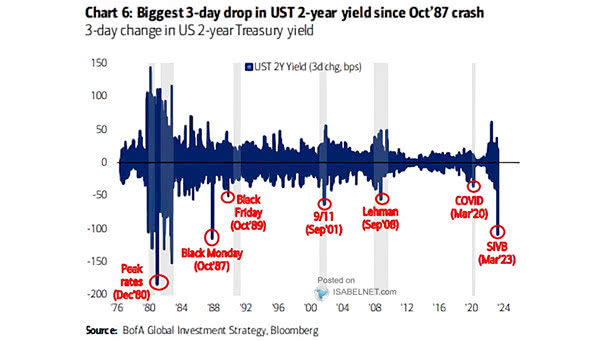
3-Day Change in U.S. 2-Year Treasury Yield The U.S. 2-year Treasury yield experienced its biggest three-day drop since October 1987. Image: BofA Global Investment Strategy
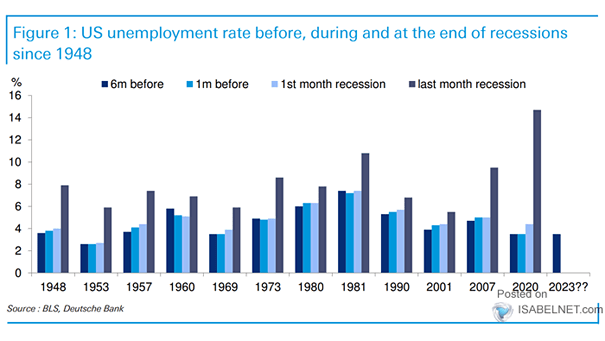
U.S. Unemployment Rate Before, During and at the End of Recessions The U.S. unemployment rate is a lagging indicator. It is not a reliable predictor of U.S. recessions. Image: Deutsche Bank
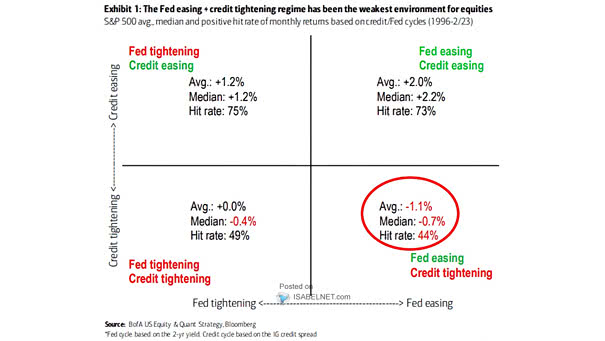
S&P 500 Average Median and Positive Hit Rate of Monthly Returns Based on Credit/Fed Cycles Fed easing and credit tightening regime does not bode well for U.S. equities. Image: BofA US Equity & Quant Strategy
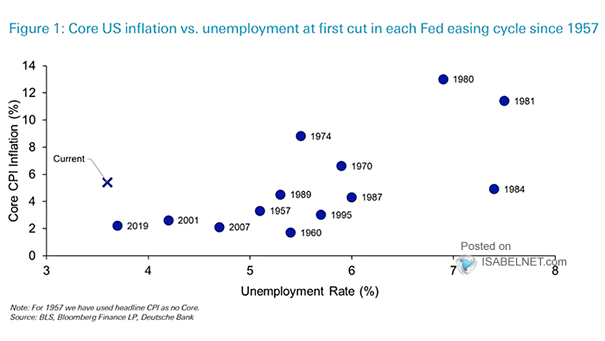
U.S. Core Inflation vs. Unemployment at First Cut in Each Fed Easing Cycle The U.S. unemployment rate and core inflation do not suggest that the Fed will cut interest rates anytime soon. Image: Deutsche Bank
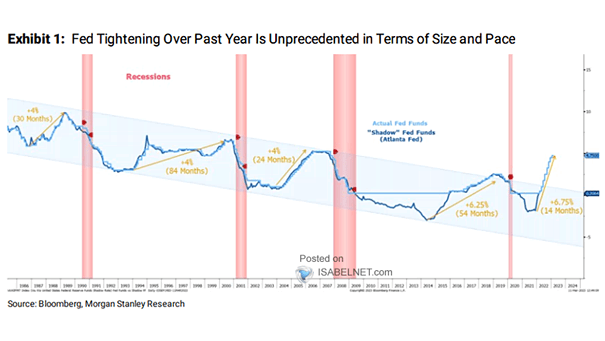
Fed Funds and Recessions Fed tightening over the past year is on an unprecedented scale. Image: Morgan Stanley Research
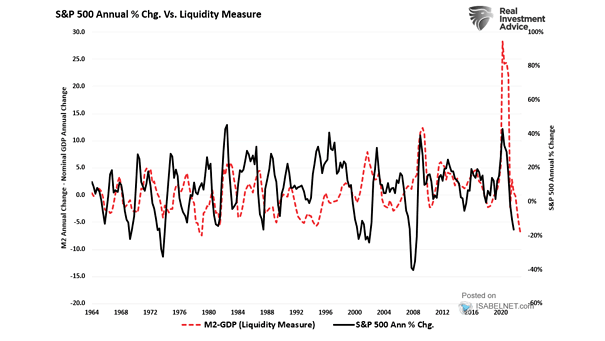
S&P 500 Annual % Change vs. Liquidity Measure Shrinking excess liquidity remains a headwind for U.S. stocks. Image: Real Investment Advice
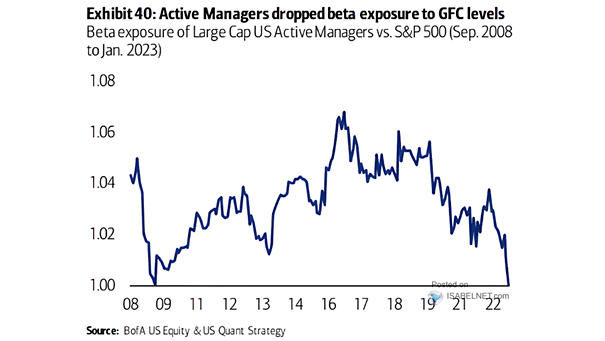
Beta Exposure of Large Cap U.S. Active Managers vs. S&P 500 Among active managers, there is a significant drop in beta exposure to GFC levels. Image: BofA US Equity & Quant Strategy
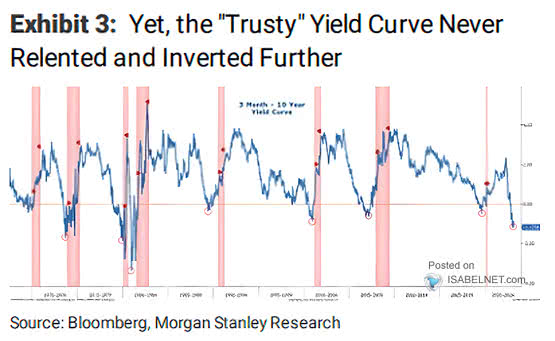
U.S. 10Y-3M Yield Curve The U.S. 10Y-3M yield curve suggests that the U.S. economy may be headed for a downturn in the near future. Image: Morgan Stanley Research