Inflation – ISM Services Business Prices vs. Copper
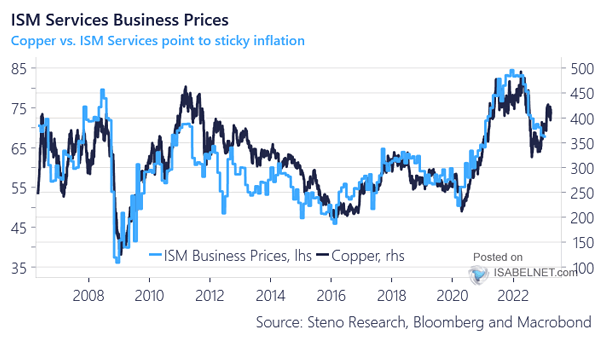
Inflation – ISM Services Business Prices vs. Copper The rise of copper prices is a cause for concern as it can lead to higher prices for a variety of goods and services. Image: Steno Research
Inflation – ISM Services Business Prices vs. Copper The rise of copper prices is a cause for concern as it can lead to higher prices for a variety of goods and services. Image: Steno Research
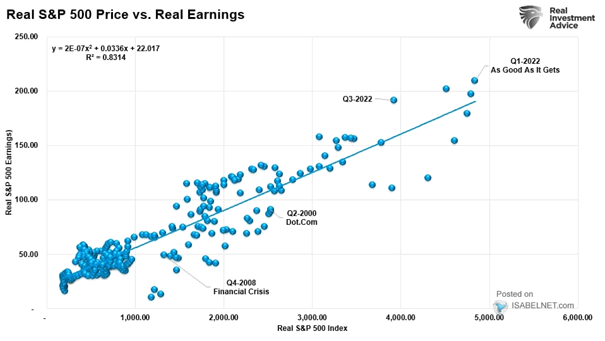
Real S&P 500 Price vs. Real Earnings Reversion to the mean is a powerful force. Should investors expect earnings to fall futher? Image: Real Investment Advice
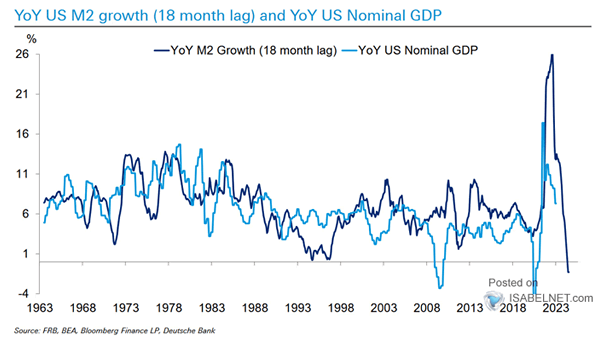
M2 Growth vs. U.S. Nominal GDP The sharp contraction in M2 growth could be a cause for concern when it comes to U.S. nominal GDP growth. Image: Deutsche Bank
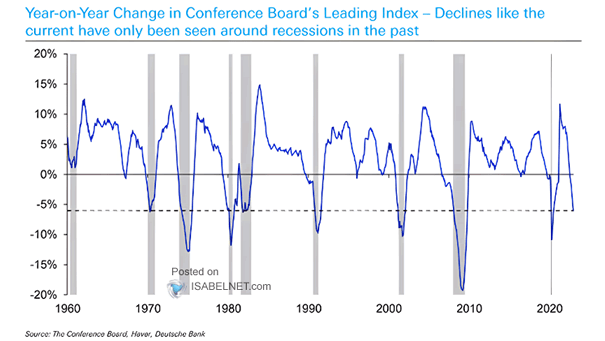
Recession – U.S. Conference Board Leading Index (LEI) Does the current decline in the U.S. Leading Economic Index (LEI) guarantee a recession within the next few months? Image: Deutsche Bank
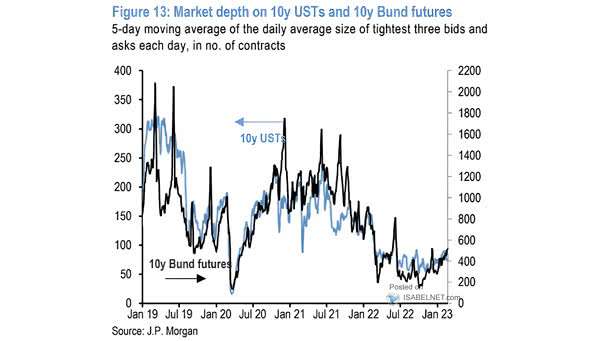
Market Depth on 10-Year USTs and 10-Year Bund Futures Will market depth on 10Y USTs and 10Y Bund futures continue to improve? Image: J.P. Morgan
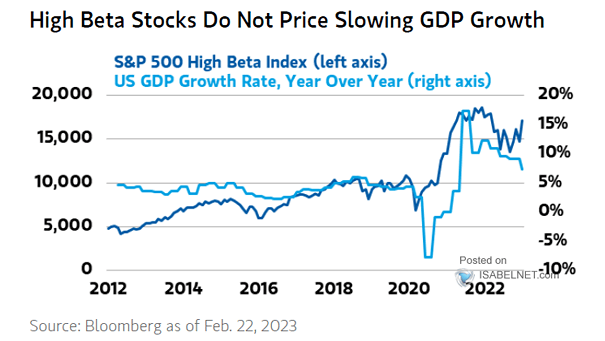
S&P 500 High Beta Index vs. U.S. GDP Growth Rate Should investors consider underweighting high beta stocks in their portfolios? Image: Morgan Stanley Wealth Management
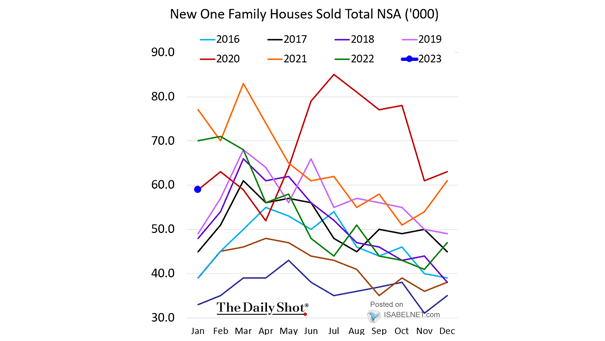
Housing – New One Family Houses Sold Total NSA U.S. new home sales rose 7.2% in January, which was better than expected. Image: The Daily Shot
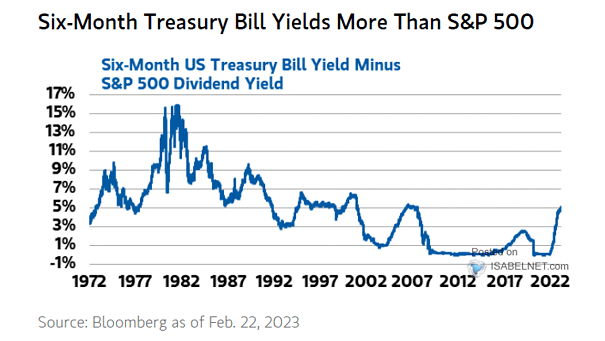
Six-Month U.S. Treasury Bill Yield Minus S&P 500 Dividend Yield Should investors favor U.S. T-bills over the S&P 500 dividend yield? Image: Morgan Stanley Wealth Management
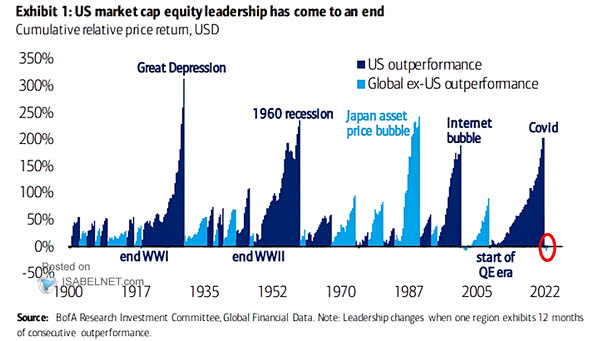
Performance – U.S. Outperformance vs. Global Ex-U.S. Outperformance Should U.S. investors favor international equities over U.S. equities? Image: BofA Research Investment Committee
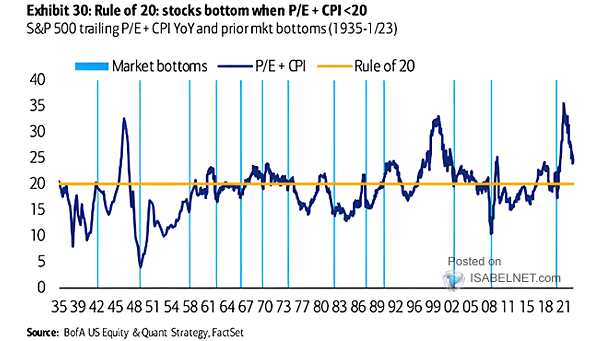
S&P 500 Trailing P/E + CPI YoY and Prior Market Bottoms Historically, U.S. stocks bottomed when the S&P 500 trailing P/E + CPI was below 20. Image: BofA US Equity & Quant Strategy
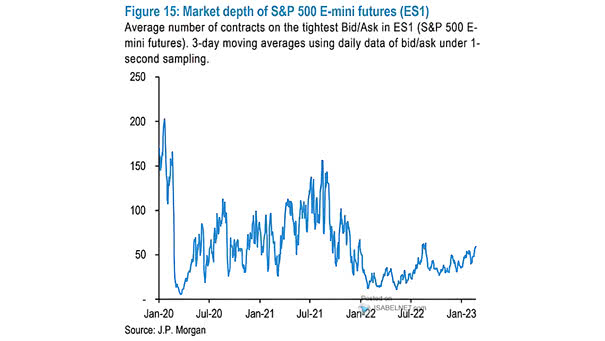
Liquidity – Market Depth of S&P 500 E-mini Futures U.S. equity market depth has been steadly improving. Image: J.P. Morgan