
Fed Funds Rate vs. Recessionary Bear Market Lows
Fed Funds Rate vs. Recessionary Bear Market Lows Fed rate cuts are historically not bullish for the S&P 500. Image: BofA Research Investment Committee
Fed Funds Rate vs. Recessionary Bear Market Lows Fed rate cuts are historically not bullish for the S&P 500. Image: BofA Research Investment Committee
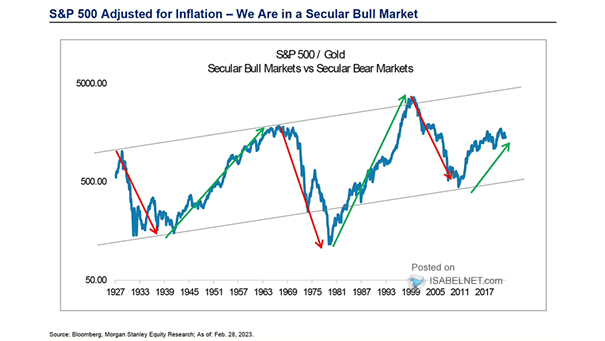
Secular Bull Markets vs. Secular Bear Markets – S&P 500 / Gold Despite occasional market fluctuations and concerns about overvaluation, the S&P 500 is still in a secular bull market. Image: Morgan Stanley Research
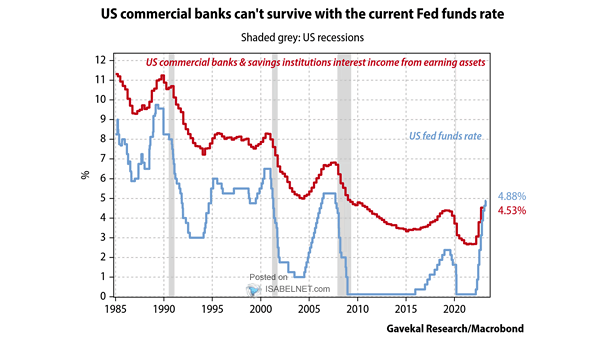
U.S. Commercial Banks and Savings Institutions Interest Income from Earnings Assets vs. U.S. Fed Funds Rate Does it really make sense to keep raising interest rates if U.S. commercial banks can’t survive with the current…
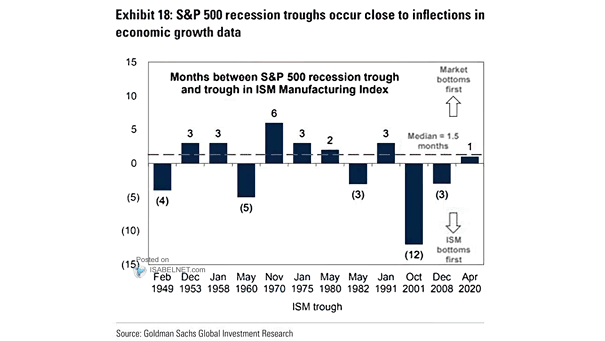
Months Between S&P 500 Recession Trough and Trough in ISM Manufacturing Index Monitoring the ISM Manufacturing Index can be useful for investors who are interested in making decisions about when to invest in the S&P…
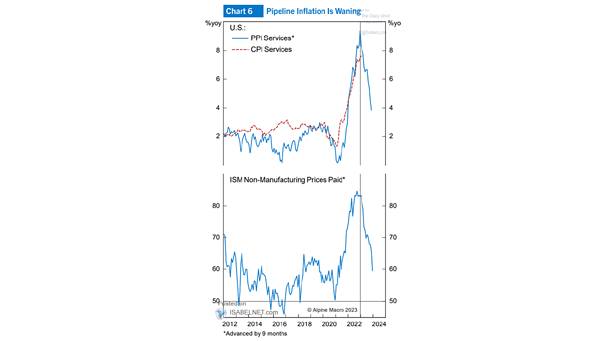
Inflation – CPI Services vs. PPI Services and ISM Non-Manufacturing Prices Paid (Leading Indicator) The ISM Non-Manufacturing Prices Paid and PPI services tend to lead CPI services by 9 months. Image: Alpine Macro
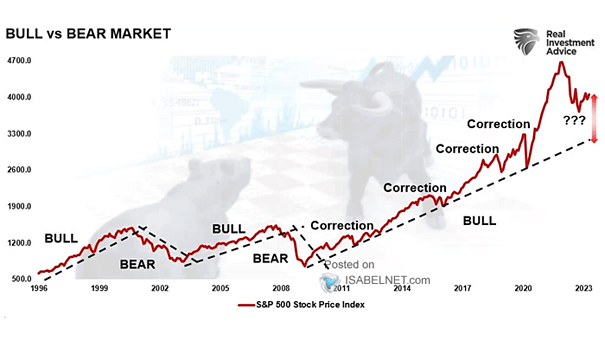
S&P 500 Index – Bull vs. Bear Market Will the S&P 500 return to its all-time high as it remains in a long-term trending bull market? Image: Real Investment Advice
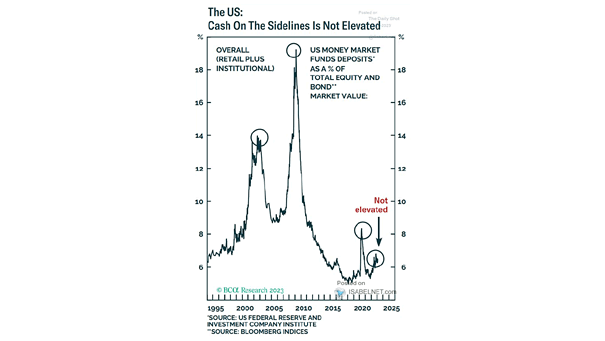
Cash – U.S. Money Market Funds Deposits as a % of Total Equity and Bond Market Value Cash on the sidelines is not as elevated as many believe. Image: BCA Research
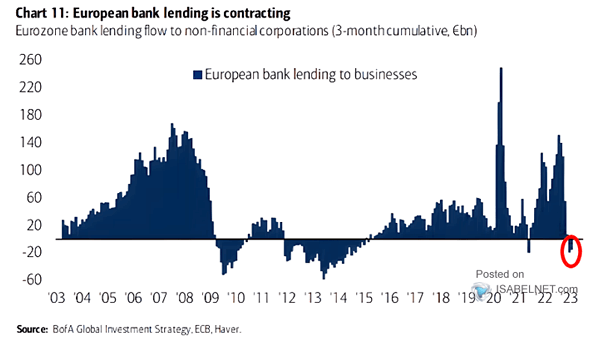
Eurozone Bank Lending Flow to Non-Financial Corporations Bank lending in the European area is contracting, which is unusual outside of crises. Image: BofA Global Investment Strategy
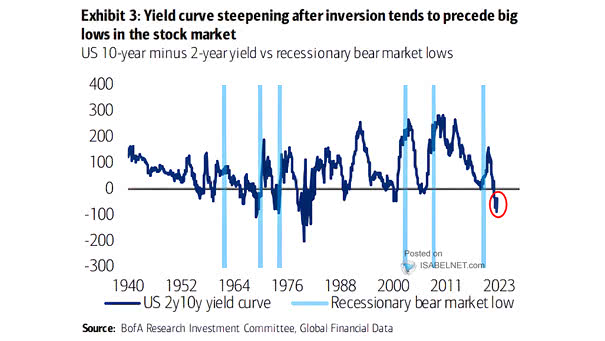
U.S. 10Y-2Y Yield Curve vs. Recessionary Bear Market Lows Historically, a steepening inverted US 10Y-2Y yield curve tends to precede recessionary bear market lows. Image: BofA Research Investment Committee
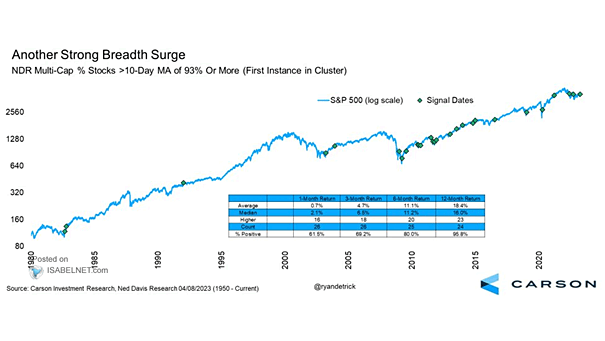
S&P 500 – NDR Multi-Cap % Stocks >10-Day Monving Average of 93% or More In recent history, when 93% of U.S. stocks or more are above their 10-day moving average, good things tend to happen…
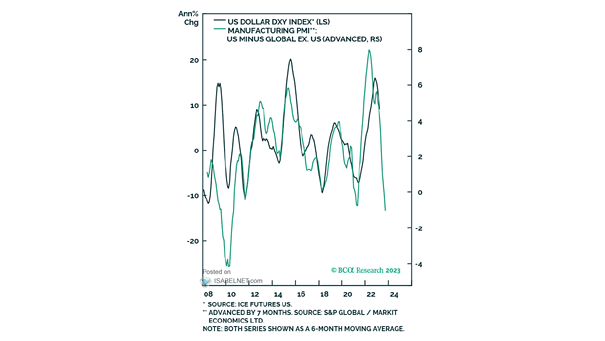
U.S. Dollar Index (DXY) vs. Manufacturing PMI (U.S. Minus Global Ex-U.S.) Will the U.S. dollar continue to weaken? Image: BCA Research