Price Volatility: Bitcoin vs. U.S. Dollar Index (DXY)
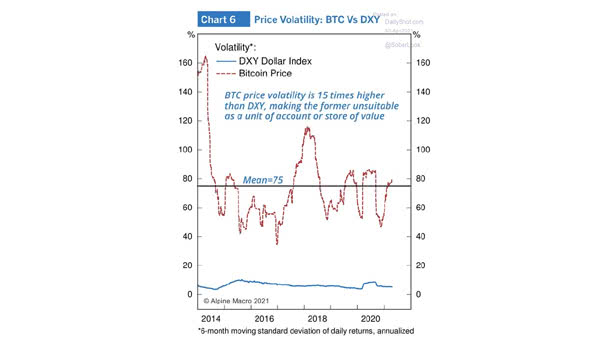
Price Volatility: Bitcoin vs. U.S. Dollar Index (DXY) Is the price of Bitcoin too volatile to be a store of value? Image: Alpine Macro
Price Volatility: Bitcoin vs. U.S. Dollar Index (DXY) Is the price of Bitcoin too volatile to be a store of value? Image: Alpine Macro
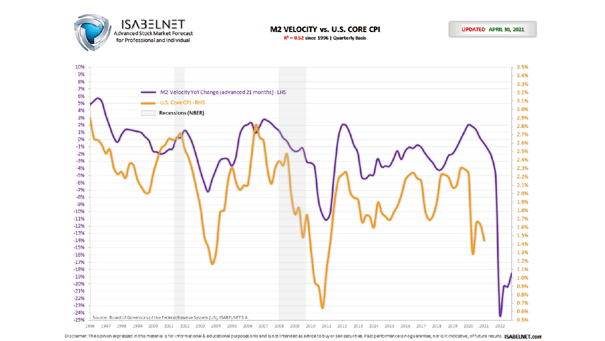
U.S. Core Inflation Expected Over the Next 21 Months (Leading Indicator) M2 velocity year-over-year tends to lead U.S. core CPI by 21 months (R² = 0.52 since 1996). It has been quite accurate for more…
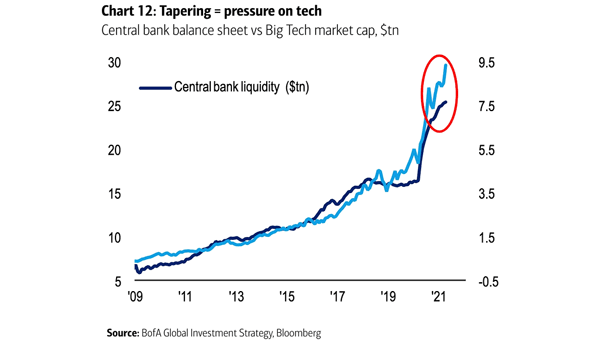
Tech Stocks – Central Bank Balance Sheet vs. Big Tech Market Capitalization Are markets too optimistic about Fed tapering? Image: BofA Global Investment Strategy
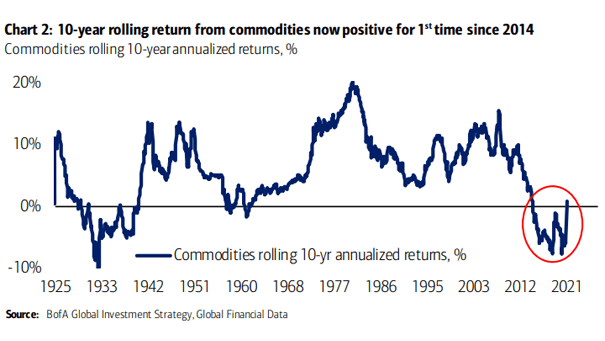
Commodities Rolling 10-Year Annualized Return Could commodities continue their comeback? Image: BofA Global Investment Strategy
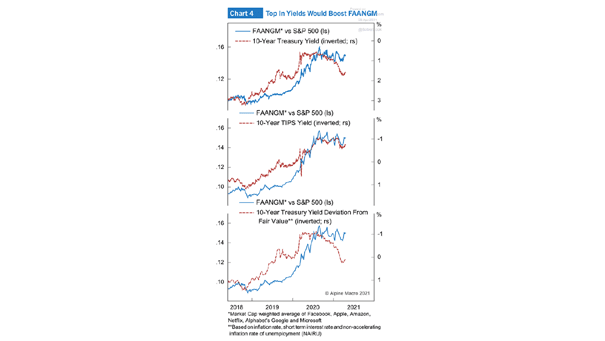
FAANGM Stocks vs. S&P 500 and U.S. 10-Year Yields A top in U.S. 10-year yields could be good news for FAANGM stocks. Image: Alpine Macro
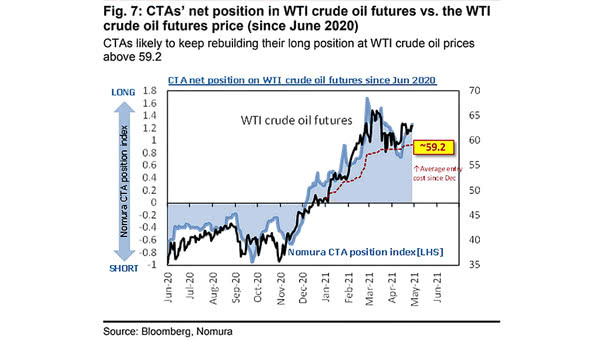
CTAs’ Net Position in WTI Crude Oil Futures vs. the WTI Crude Oil Futures Price CTAs have increased their net long positions in WTI crude oil futures. Image: Nomura
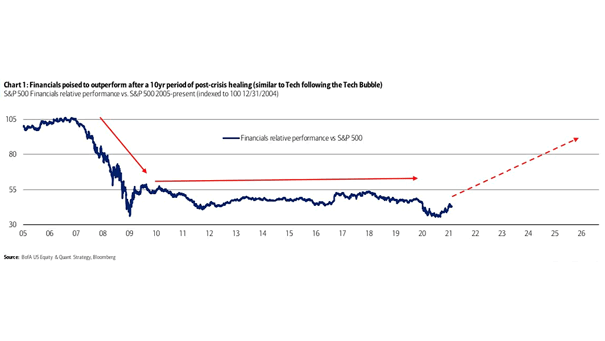
S&P 500 Financials Relative Performance vs. S&P 500 Will financials outperform the S&P 500 over the next few years? Image: BofA US Equity & Quant Strategy
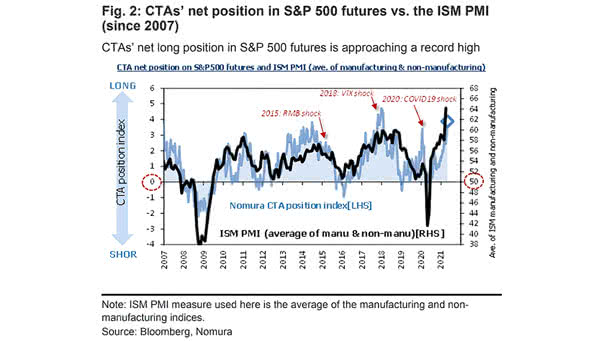
CTAs’ Net Position in S&P 500 Futures vs. the ISM PMI CTAs remain net buyers of S&P 500 futures. Image: Nomura
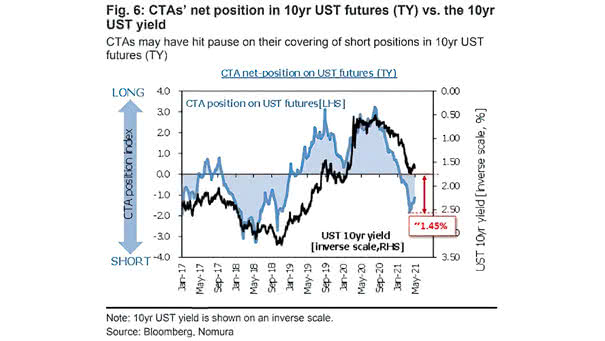
CTAs’ Net Positions in 10-Year U.S. Treasury Futures vs. the 10-Year U.S. Treasury Yield CTAs appear to have paused in covering their short positions in 10-year U.S. Treasury futures. Image: Nomura
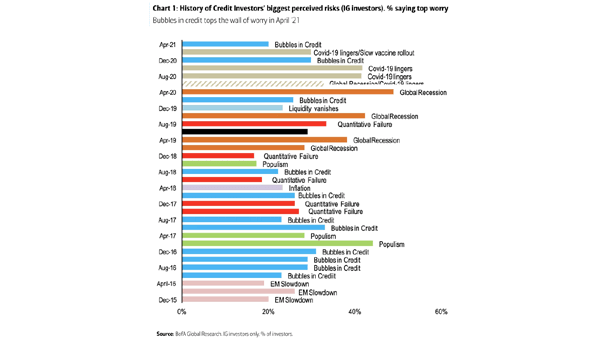
Bubbles – History of Credit Investors’ Biggest Perceived Risks Is there a credit bubble in the making? Image: BofA Global Research
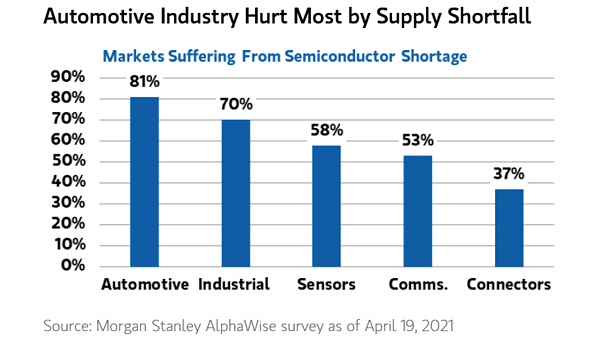
Markets Suffering From Semiconductor Shortage How long will the semiconductor shortage last? Image: Morgan Stanley Wealth Management