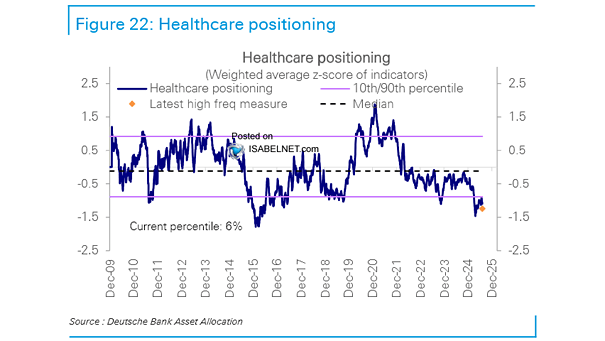
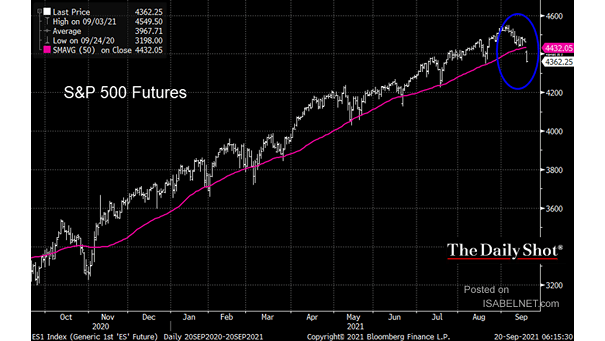
U.S. Dollar and 200-Day Moving Average
U.S. Dollar and 200-Day Moving Average The DXY dollar’s current position well below its 200-day moving average marks a rare bearish phase, the likes of which have not been seen in two decades, signaling a…
Asset Class Returns Diversified portfolios demonstrated strong resilience during the U.S. stock market drawdowns in the first half of 2025 by cushioning losses and providing more stable returns. Image: J.P. Morgan Asset Management
S&P 500 Performance Up YTD Between 5-10% at the Midpoint of the Year Since 1950, when the S&P 500 has been up between 5% and 10% by mid-year, the full-year performance has been positive 93%…
U.S. 10-Year Treasury Yield and Economic Surprise Index Weakening U.S. economic data and evolving fiscal conditions have led Goldman Sachs to revise down Treasury yield forecasts, anticipating a more accommodative monetary policy with earlier and…
S&P 500 Energy / S&P 500 The energy sector’s current low relative price performance combined with attractive valuations and strong underlying fundamentals makes it a compelling value investment opportunity for investors seeking exposure to this…
S&P 500 Performance While the S&P 500 is on track for a third consecutive monthly gain, supported by strong earnings expectations, some investors remain cautious about its sustainability given high valuations and geopolitical uncertainties. Image:…
Global Equity Valuations The market environment favors global ex-U.S., small-cap, and value stocks for their cheap valuations and growth potential, while U.S., large-cap, and growth stocks face valuation headwinds and higher downside risk. Image: Topdown…
Forward EPS YoY % Change vs. S&P 500 Annual Rate of Change Corporate earnings play a key role in shaping market performance. In 2025, the expected U.S. economic slowdown might limit their growth, challenging stock…
S&P 500 Returns After a Golden Cross (50-Day MA Above the 200-Day MA) Since 1950, the S&P 500’s golden cross has been a reliable bullish signal, generating median returns of 13% over the following year,…
Consumer Sentiment Index and Subsequent 12-Month S&P 500 Returns Throughout history, steep declines in consumer sentiment have often been followed by strong stock market rallies over the next year, making these sentiment lows a potentially…
Earnings Growth – Mag 7 and S&P 500 ex-Mag 7 While the pace of earnings growth for the Magnificent Seven is expected to moderate from the explosive gains of recent years, they are still forecast…