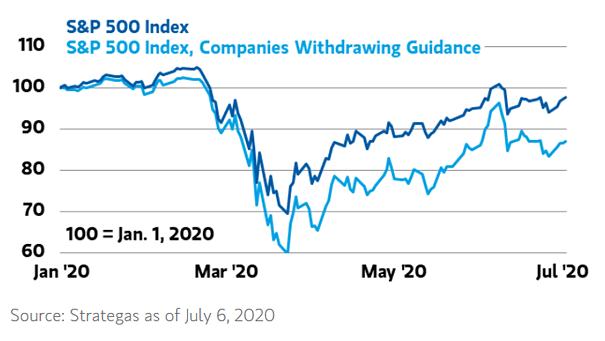
U.S. Dollar and Relative Equity Performance

U.S. Dollar and Relative Equity Performance Chart suggesting the pretty close relationship between U.S. dollar cycles and relative equity performance over the last 50 years. Image: Oxford Economics, Macrobond

Blended Money Supply vs. U.S. Nominal GDP

Blended Money Supply vs. U.S. Nominal GDP Historically, U.S. nominal GDP growth tends to track money supply growth. More inflation to come? Image: Deutsche Bank

Wave of Zombie Companies in Europe

Wave of Zombie Companies in Europe Zombie companies in Europe are back on the rise, thanks to an unprecedentedly easy monetary policy. Image: BofA Global Research