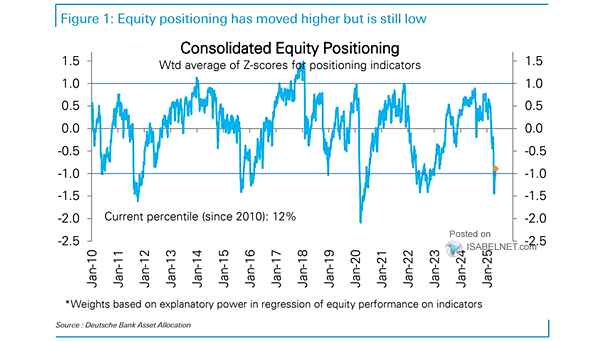
Sentiment Indicator and Stock Positioning

Sentiment Indicator and Stock Positioning Goldman Sachs’ U.S. Equity Sentiment Indicator currently stands at -0.1. Historically, readings at this level have tended to be followed by gains in the S&P 500 over the following month.…

U.S. High Yield Corporate Bond Spreads

U.S. High Yield Corporate Bond Spreads While tight high-yield credit spreads reflect strong market confidence, they also warrant caution as they may mask underlying vulnerabilities and investor complacency. Therefore, vigilant monitoring of credit spreads is…

Atlanta Fed GDPNow U.S. Real GDP Estimate

Atlanta Fed GDPNow U.S. Real GDP Estimate The Atlanta Fed’s GDPNow model projects US real GDP will expand at a 2.9% annualized rate in Q2 2025, marking a significant rebound from the prior quarter’s contraction.…

The Link To Oil

The Link To Oil Oil consumption is deeply embedded in nearly every facet of modern life, from the food we eat to the products and services we purchase. This widespread use makes oil demand a…

S&P 500 Win Streaks the Month of July

S&P 500 Win Streaks the Month of July For 10 straight years, the S&P 500 has gained in July—an impressive record. Historically, July is the best month for stocks in post-election years. Another gain this…

U.S. Households’ (Incl. Hedge Fund) Asset Allocation

U.S. Households’ (Incl. Hedge Fund) Asset Allocation U.S. households are currently heavily overweight in equities relative to fixed income, reflecting strong conviction in U.S. equity markets despite ongoing economic uncertainties and cautious positioning in bonds.…

S&P 500 Index

S&P 500 Index The S&P 500’s near-overbought technical condition raises the likelihood of short-term volatility or a consolidation phase as the market absorbs recent gains. Image: Bloomberg