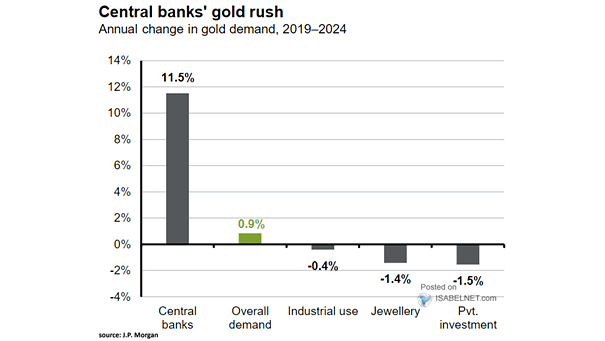
U.S. 10Y-2Y Yield Curve

U.S. 10Y-2Y Yield Curve While a steepening inverted yield curve has historically warned of recession, persistent economic strength could mean a more positive outlook for U.S. equities in 2025—though this would mark a notable break…

S&P 500 Drawdown and Insider Buying/Selling

S&P 500 Drawdown and Insider Buying/Selling The Vickers insider sell/buy ratio, which tracks corporate insider transactions, indicates insiders perceive value at current price levels—a trend historically viewed as a bullish signal for market direction. Image:…

Gold vs. U.S. M2 and U.S. Debt to GDP

Gold vs. U.S. M2 and U.S. Debt to GDP Historically, gold prices have tracked the expansion of the money supply and have responded to increases in U.S. government debt. Image: J.P. Morgan Commodities Research

ISABELNET Cartoon of the Day

ISABELNET Cartoon of the Day Bulls are confident that the bull market in 2025 is as secure as a dog with a bone—stay ready for surprises! Have a Great Day, Everyone! 😎

Equities – MSCI U.S./RoW Distance from 200-DMA

Equities – MSCI U.S./RoW Distance from 200-DMA The MSCI U.S./RoW distance from the 200-DMA highlights a major interruption to the narrative of U.S. exceptionalism and reinforces the need for global diversification in equity portfolios. Image:…

ISABELNET Cartoon of the Day

ISABELNET Cartoon of the Day Wall Street bears are convinced the bull market is crazy, but bulls are too busy wearing noise-canceling headphones to hear any warnings. Happy “Hump” Day, Everyone! 🐫🐪😎

U.S. Bitcoin ETF Flows

U.S. Bitcoin ETF Flows U.S. Bitcoin ETFs have experienced strong inflows. Bitcoin has rebounded over 20% from its early April low, surpassing $90,000. During this period, Bitcoin has significantly outperformed U.S. equities. Image: Bloomberg

Dow Jones Industrial Average vs. Smart Money Flow Index

Dow Jones Industrial Average vs. Smart Money Flow Index The Smart Money Flow Index currently suggests that the most probable short-term direction for the U.S. stock market is upward. Image: Paulsen Perspectives

S&P 500 Valuations

S&P 500 Valuations The composite S&P 500 valuation indicator—which integrates PE ratios, equity risk premia, and price-based mean reversion factors—has recently reset to a level close to neutral, which is an encouraging sign. Image: Topdown…