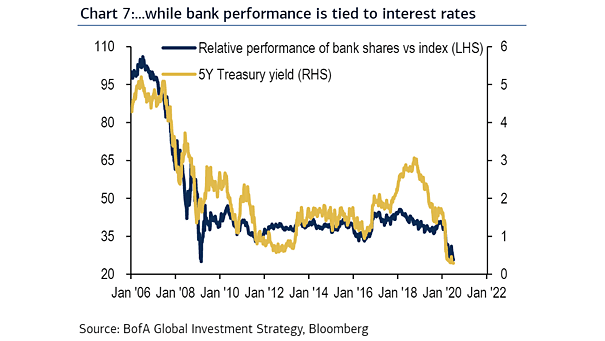
Sentiment – AAII Bull/Bear Spread and S&P 500
Sentiment – AAII Bull/Bear Spread and S&P 500 Retail investors remain bearish, despite the market rally. Image: Morgan Stanley Research
S&P 500 Index Weights The S&P 500 has changed a lot over the last 100 years. Image: Morgan Stanley Research
S&P 500 Long-Term Perspective In times of uncertainty, this chart puts into perspective the long-term returns of the S&P 500 since 1880. Image: BCA Research
S&P 500 Futures Liquidity and Volatility S&P 500 futures liquidity is improving, but remains at low levels and continues to be contingent on volatility. Image: Societe Generale Cross Asset Research
MSCI USA Cyclical Sectors-Defensive Sectors Spread USD Index vs. 2-Year/30-Year U.S. Treasury Yield Curve This chart suggests that cyclical outperformance of defensives tends to be correlated with the shape of the 2-year/30-year U.S. Treasury yield…
U.S. Savings Rate Will the coronavirus pandemic lead to a permanent increase in the savings rate? Image: J.P. Morgan
S&P 500 Value and Growth Relative to S&P 500 Growth stocks continue to outperform value stocks year-to-date. Image: Morgan Stanley Research
S&P 500 and EPS Forecasts Morgan Stanley is bullish and expects a V-shaped recovery. Image: Morgan Stanley Research
Increase in Real U.S. GDP during First Year of Recovery vs. Decrease in Real U.S. GDP during Recession The deeper the fall in U.S. GDP, the faster the rebound. Image: BCA Research
S&P 500 Today vs. S&P 500 in 2009 Chart suggesting that the market is following the 2009 pattern. Image: Morgan Stanley Research
S&P 500 and Chicago Fed National Financial Conditions Index Fed financial conditions continue to improve, which is historically bullish for U.S. equities. Image: BofA Global Research