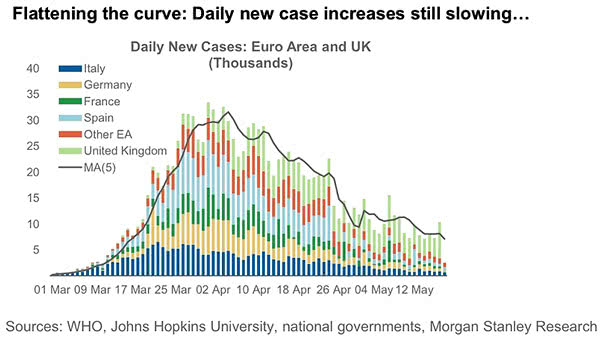
S&P 500 and Composite Momentum Indicator

S&P 500 and Composite Momentum Indicator This chart suggests that the composite momentum indicator exposes investors to the risk of a short-term correction. Image: BCA Research

S&P 500 – Today Compared with 1929

S&P 500 – Today Compared with 1929 This chart comparing the S&P 500 to 1929 suggests that the S&P 500 could find support without a full retest of the lows. Image: Deutsche Bank Global Research

Central Bank Balance Sheets

Central Bank Balance Sheets The Fed appears as the central bank with the highest room to increase its balance sheet. Image: Credit Suisse Research

In Fed We Trust

In Fed We Trust Confidence in Fed chair has reached a 15-year high. Image: Bloomberg

U.S.: Funds Authorized by Congress

U.S.: Funds Authorized by Congress Funds authorized by Congress exceed those of the Great Financial Crisis. Image: Oxford Economics

Hedge Fund Net Asset Flows

Hedge Fund Net Asset Flows Investors pulled $33bn from hedge funds in the first quarter of 2020, as market volatility surges on coronavirus pandemic uncertainty. Image: Financial Times