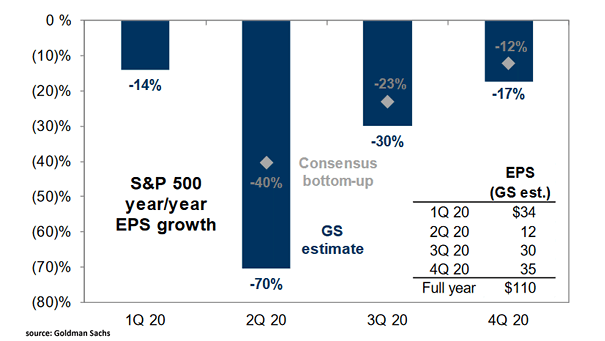
Year/Year EPS Growth – Magnificent 7 vs. S&P 493
Year/Year EPS Growth – Magnificent 7 vs. S&P 493 EPS growth for the Magnificent 7 is expected to cool to 14% in Q3, down from 28%. Mega-cap tech names should continue posting robust earnings growth,…
Year/Year EPS Growth – Magnificent 7 vs. S&P 493 EPS growth for the Magnificent 7 is expected to cool to 14% in Q3, down from 28%. Mega-cap tech names should continue posting robust earnings growth,…
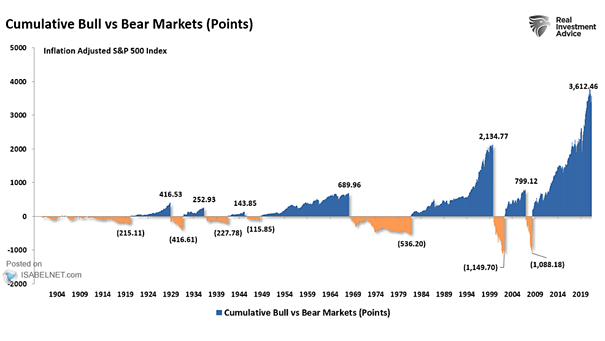
Cumulative Bull vs. Bear Markets Why do bear markets matter? Because most of the gains of an inflation-adjusted bull run can be erased when the next downturn hits. Image: Real Investment Advice
Contribution of Sector Groups to S&P 500 Earnings Growth MCG and Tech have all but carried the market lately, fueling nearly 90% of the S&P 500’s earnings growth. Wall Street’s climb is still a tech‑powered…
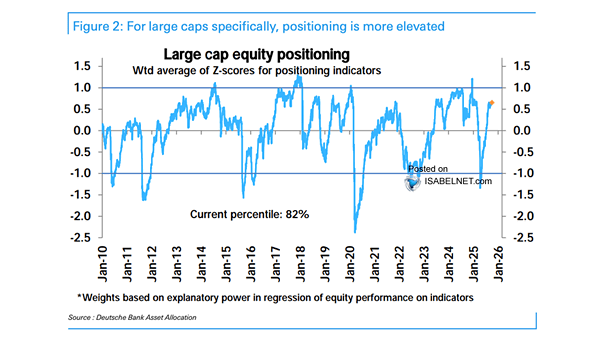
Large Cap Equity Positioning Markets overall are far from stretched, but in large-cap equities, positioning has climbed to the 82nd percentile, where momentum in big-name stocks is clearly picking up. Image: Deutsche Bank Asset Allocation
S&P 500 Index and Barclays Equity Timing Indicator Barclays’ Equity Timing Indicator—a gauge of 19 market and economic signals—is tilting bullish, implying an 82% chance the S&P 500 rises over the next two months, with…
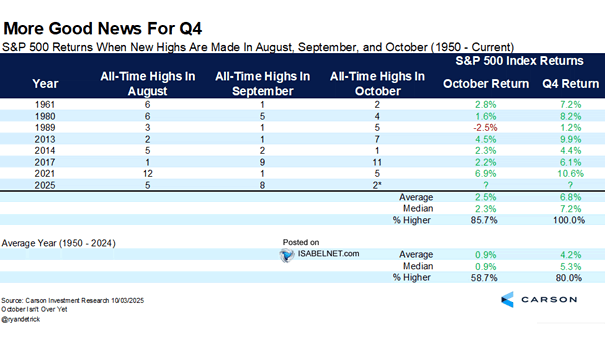
S&P 500 Returns when New Highs Are Made in August, September, and October History is on the bulls’ side: whenever the S&P 500 has hit new highs in August, September, and October, the fourth quarter…
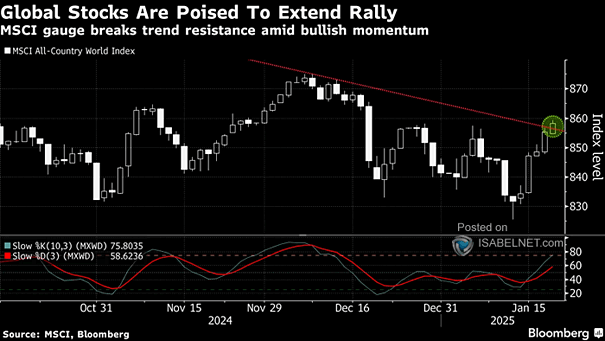
Equities – MSCI U.S. vs. MSCI ACWI ex-U.S. American equities are falling out of step with their global peers, lagging by roughly 9%—the biggest divide since 2009—amid currency shifts and a revival of interest in…
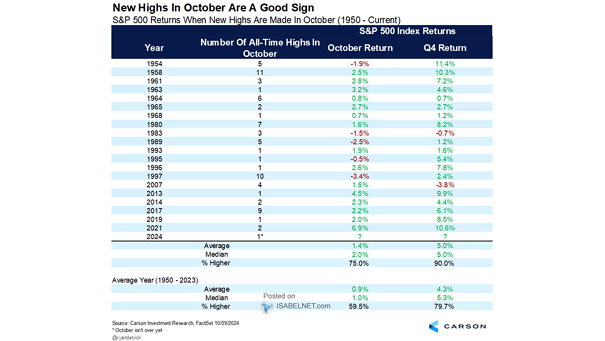
S&P 500 Returns When New Highs Are Made In October Bulls welcome October’s new highs, knowing the fourth quarter has been kind: markets have risen more than 90% of the time, with average gains of…
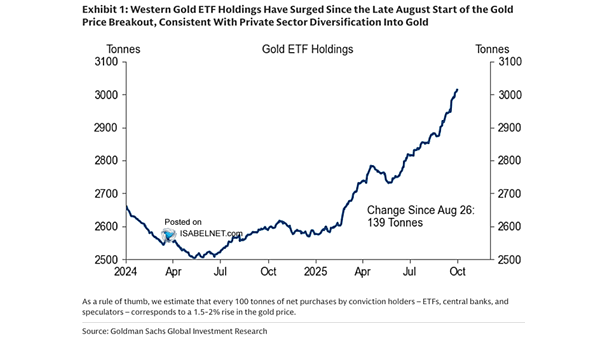
Gold ETF Holdings The surge in Western gold ETF holdings tells a story of fragile nerves and strong convictions—uncertain macro signals, anticipated rate cuts, and a search for safety pushing both private investors and central…
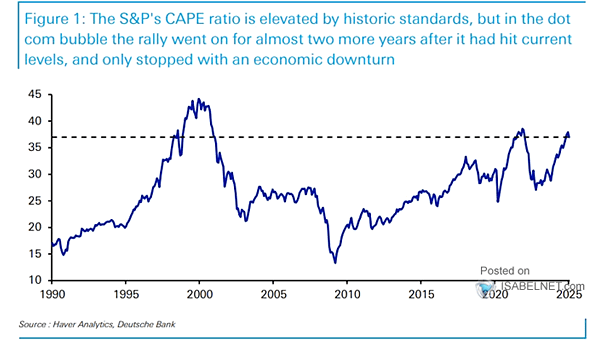
Valuation – S&P 500 CAPE Ratio For a while, valuations look irrelevant—until they dictate everything. Over the past 150 years, stretched multiples have reliably led to leaner returns, with the last three peaks leaving investors…
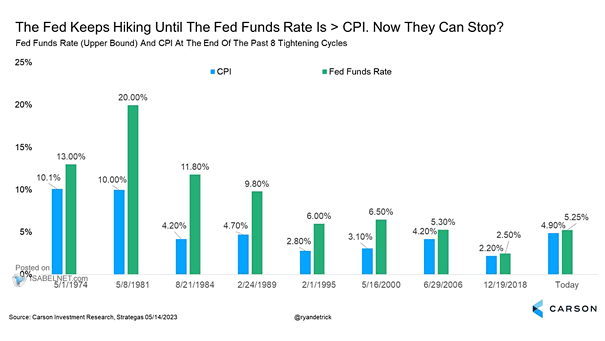
Inflation – Fed Funds Rate and CPI With the Fed funds rate still running well above inflation, policy looks overly tight—and investors are betting on deeper rate cuts to follow. Image: Real Investment Advice