Survey – 10-Year U.S. Treasury Yields
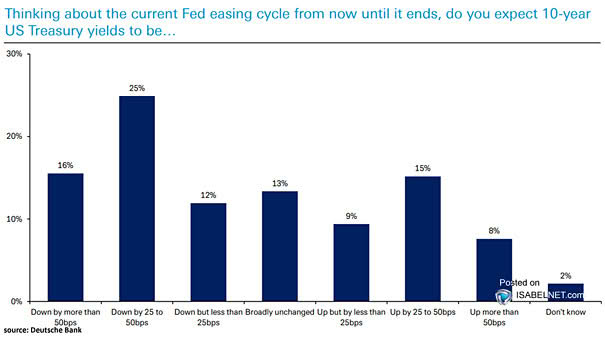
Survey – 10-Year U.S. Treasury Yields While expectations tilt toward falling 10-year U.S. Treasury yields, plenty of voices argue for a rise, citing everything from sticky inflation to uncertain rate cuts and uneven economic growth.…