S&P 500 and VIX/10-Year U.S. Treasury Ratio
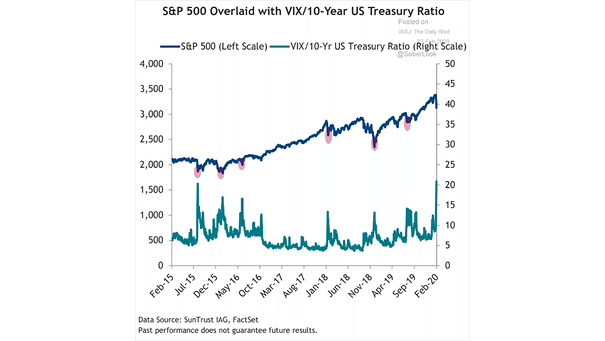
S&P 500 and VIX/10-Year U.S. Treasury Ratio Chart showing how spikes in the VIX/10-Year U.S. Treasury ratio result in lower equity prices. Image: Truist
S&P 500 and VIX/10-Year U.S. Treasury Ratio Chart showing how spikes in the VIX/10-Year U.S. Treasury ratio result in lower equity prices. Image: Truist
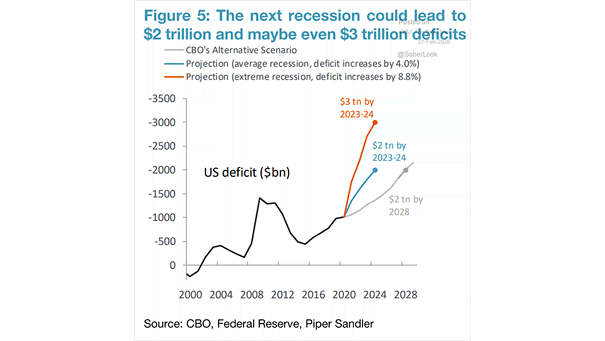
U.S. Deficit Projection Chart suggesting that the next recession could boost the U.S. deficit to unprecedented levels. Image: Piper Sandler
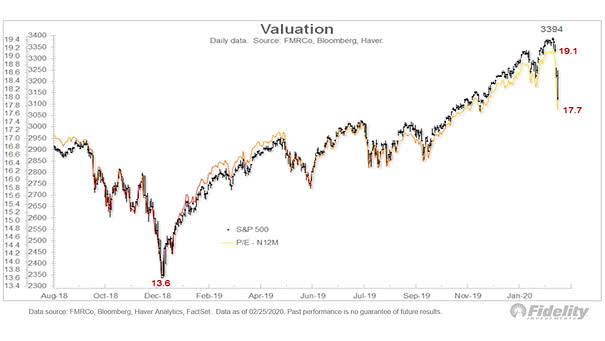
S&P 500 Valuation and P/E Next Twelve Months Chart showing that the S&P 500 forward P/E has dropped from 19.1x to 17.7x. Image: Fidelity Investments
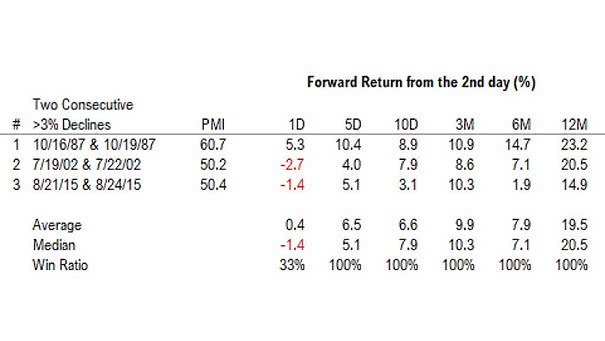
S&P 500 Forward Return and Two Consecutive 3% Declines This table suggests that the current sell-off is a correction in a bull market. Image: Fundstrat Global Advisors, LLC
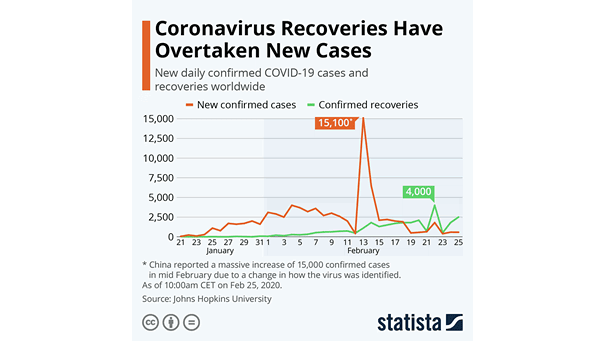
Coronavirus – New Confirmed Cases vs. Confirmed Recoveries For the first time, the number of recoveries exceeds the total number of daily new infections. Image: Statista
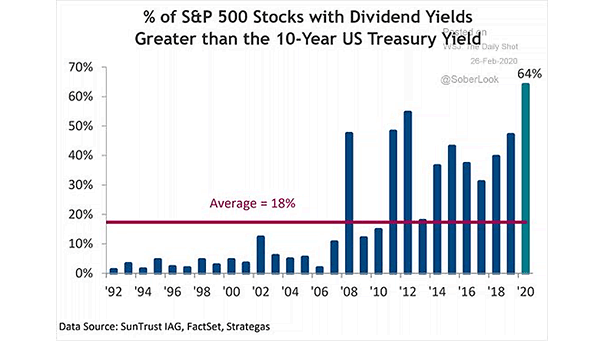
% of S&P 500 Stocks with Dividends Yields Greater than the 10-Year Treasury Yield Dividend yields on S&P 500 stocks seem competitive vs. U.S. Treasuries, but equity risk does not disappear because a company pays…
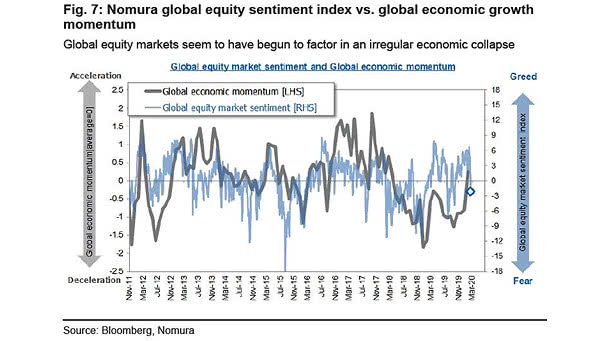
Global Equity Market Sentiment Index vs. Global Economic Growth Momentum If the global equity market sentiment index remains below zero, it could suggest a slowdown in economic momentum. Image: Nomura
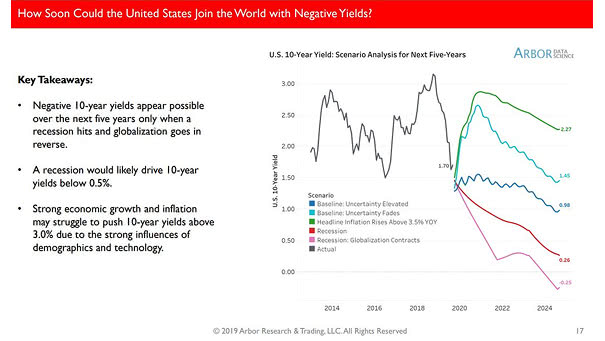
How Soon Could the United States Join the World with Negative Yields? This chart suggests that negative 10-year yields seem possible over the next five years. Image: Arbor Research & Trading LLC
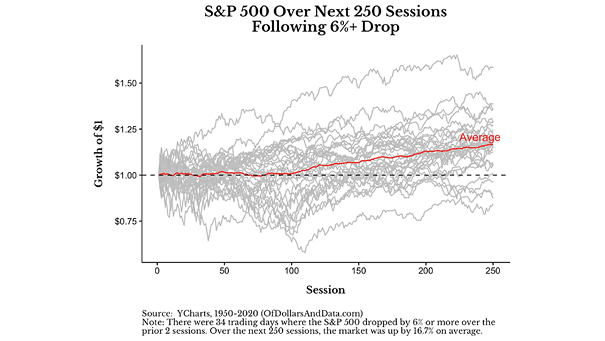
S&P 500 Over Next 250 Sessions Following 6%+ Drop Historically, when the S&P 500 dropped by 6% or more over the prior two sessions, it was up by 16.7% on average over the course of…
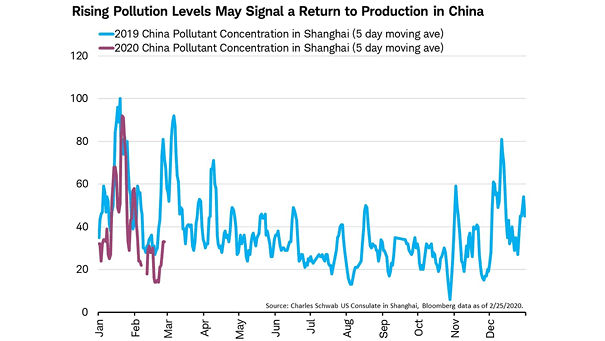
China Pollutant Concentration in Shanghai Chart suggesting that production in China is resuming, as air pollution in Shanghai is increasing. Image: Charles Schwab
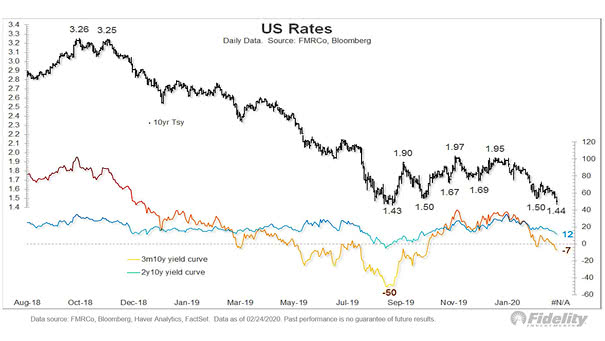
U.S. Rates and Yield Curve The inverted 10Y-3M yield curve suggests that monetary policy is becoming too tight. Image: Fidelity Investments